Data-driven decision making has evolved from a competitive advantage to a fundamental business requirement, yet the gap between data availability and data understanding remains one of the most significant challenges organizations face. Most businesses today collect far more data than they effectively analyze — customer transactions, website analytics, operational metrics, financial records, and market data accumulate in databases and spreadsheets that remain largely unexplored because the technical skills required to query databases and create meaningful visualizations historically excluded most business users from direct data exploration. Tableau transformed this landscape by creating a visual analytics platform that enables business users, analysts, and data scientists to explore, analyze, and communicate data insights through interactive visualizations without requiring programming expertise — democratizing data analysis across entire organizations and fundamentally changing how businesses interact with and understand with their information.
Founded in 2003 by Christian Chabot, Pat Hanrahan, and Chris Stolte at Stanford University, Tableau was built on academic research into visual database querying and interactive data exploration. The platform introduced the groundbreaking concept of drag-and-drop visual analytics that generates optimized database queries automatically, enabling business users to create sophisticated data visualizations by directly manipulating data fields rather than writing SQL queries or code. Acquired by Salesforce in 2019 for approximately $15.7 billion, Tableau has expanded its platform to include cloud-hosted analytics, embedded analytics, natural language querying, and AI-powered insights while maintaining the visual exploration philosophy that established its market position. Understanding Tableau’s extensive capabilities, deployment options, and data connectivity helps organizations evaluate whether this visual analytics platform meets their business intelligence requirements or whether alternative analytics tools offer specific advantages for specific use cases.
Visual Analytics Interface
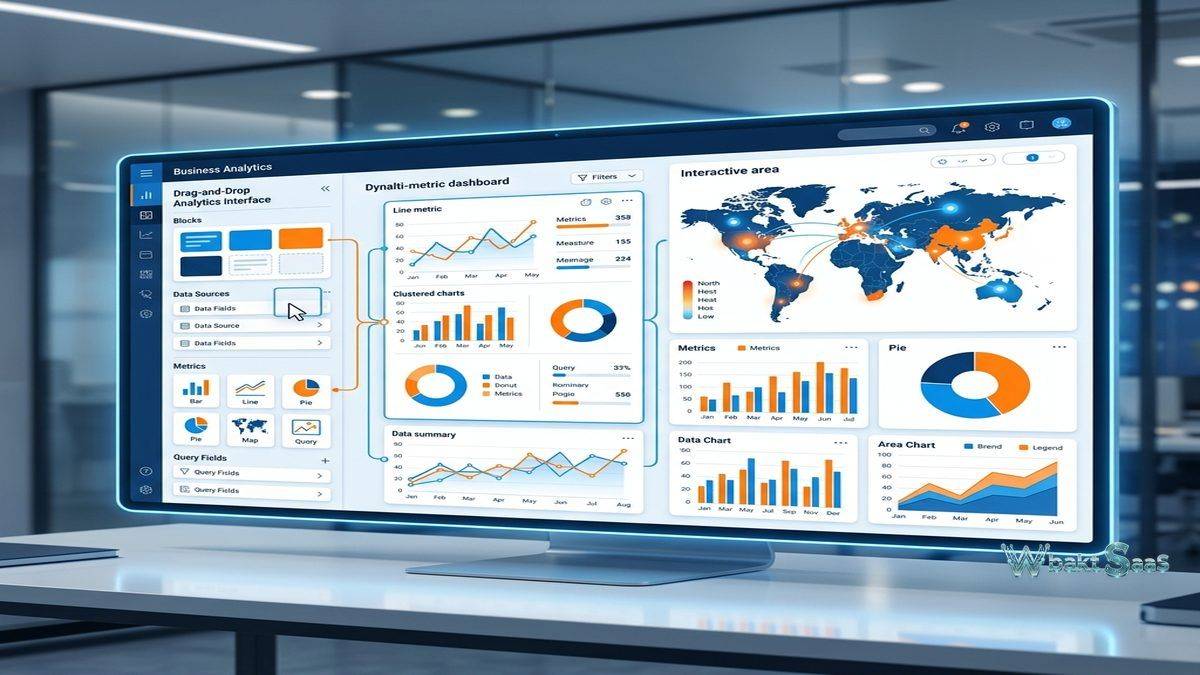
Tableau’s drag-and-drop interface enables creating visualizations by placing data fields onto rows, columns, color, size, and other visual encoding shelves. The powerful VizQL (Visual Query Language) engine automatically translates visual actions into optimized database queries, executing analytical computations at the data source level for performance. This intuitive approach means that users create bar charts, line graphs, scatter plots, heat maps, treemaps, geographic maps, and dozens of other visualization types through direct manipulation rather than chart configuration dialogs. The “Show Me” feature recommends appropriate visualization types based on the selected data fields, guiding users toward effective visual representations of their data. Marks cards provide fine-grained control over the visual encoding of data points through color, size, shape, label, and tooltip properties.

Data Connectivity
Tableau connects to a comprehensive range of data sources including relational databases (PostgreSQL, MySQL, SQL Server, Oracle, Amazon Redshift), cloud data warehouses (Snowflake, Google BigQuery, Databricks), flat files (CSV, Excel, JSON), cloud applications (Salesforce, Google Analytics, ServiceNow), and web data connectors for custom data sources. Live connections query data sources in real-time for the most current data analysis. Extract connections create optimized local snapshots of data for faster performance with large datasets. Data blending enables combining data from multiple sources without requiring database-level joins, creating analytical views across data that resides in separate systems. The remarkable breadth of connectivity ensures that Tableau can analyze data regardless of where it is stored.
Calculated Fields and Analytics
Calculated fields create new data dimensions and measures using Tableau’s formula language. String functions, date functions, logical functions, aggregate functions, and table calculations provide comprehensive analytical computation capabilities. Level of Detail (LOD) expressions enable calculations at specific aggregation levels independent of the current visualization granularity — a uniquely powerful capability for creating contextual comparisons, ratios, and benchmarks. Table calculations compute values based on the visible table structure, enabling running totals, moving averages, percentile rankings, and year-over-year comparisons. Parameters enable creating user-adjustable values that can modify visualizations, calculations, and reference lines dynamically, creating interactive analytical experiences.
Dashboard Creation
Dashboards combine multiple visualizations, text, images, and interactive elements into unified analytical layouts. Dashboard actions enable rich interactivity between visualizations — selecting a data point in one chart filters, highlights, or navigates to related information in other charts on the same dashboard. Filter actions, highlight actions, URL actions, and parameter actions create rich interactive experiences that enable users to explore data through clicking and selecting rather than configuring separate analyses. Responsive design automatically accommodates dashboard viewing across desktop and mobile devices. Dashboard containers organize layout elements with precise positioning controls. Device-specific layouts enable creating optimized views for desktop, tablet, and phone screen sizes from a single dashboard design.
Mapping and Spatial Analysis
Tableau includes built-in geographic capabilities with integrated mapping that supports country, state, city, postal code, and coordinate-based geographic visualizations. Map layers display detailed background geography, data layers, and custom geographic shapes. Spatial file support includes shapefiles, GeoJSON, KML, and MapBox integration for custom map styling. Geographic calculations compute distances, create geographic clusters, and enable spatial filtering. For organizations analyzing geographically distributed data — sales territories, customer locations, logistics routes, real estate portfolios, and demographic patterns — Tableau’s mapping capabilities provide visual geographic analysis without requiring separate GIS software.
Tableau Server and Tableau Cloud
Tableau Server provides on-premises deployment for organizations requiring data residency control and integration with internal infrastructure. Tableau Cloud provides fully managed cloud hosting without server administration requirements. both platforms enable publishing, sharing, collaborating, and governing on visualizations and dashboards across the organization through web browsers and mobile applications. Content management organizes published content in projects with permission-based access control. Scheduling capabilities enable automated data refreshes and report distribution. Subscriptions enable users to receive dashboard snapshots via email on configured schedules. Data governance features control data access, certification, and quality standards across the analytics platform.
Natural Language Processing
Ask Data enables users to type natural language questions and receive automatic visualizations in response. Users type questions like “show me sales by region for last quarter” and Tableau generates appropriate visualizations. Explain Data automatically identifies potential explanations for data values, highlighting statistical outliers and suggesting contributing factors. These AI-powered features lower the analytics barrier further, enabling casual business users to access data insights without even the drag-and-drop skills that Tableau’s visual interface requires. While natural language querying does not replace skilled visual analysis for complex analytical work, it provides accessible data exploration for routine questions and ad-hoc inquiries.
Tableau Prep
Tableau Prep provides visual data preparation that cleans, shapes, and combines data before analysis. The visual flow interface clearly shows data transformation steps as a directed graph, making complex data preparation processes transparent and auditable. Cleaning operations effectively handle null values, type mismatches, inconsistent formatting, and duplicate records. Pivot, union, and join operations restructure data for analytical requirements. Tableau Prep Builder creates preparation flows on the desktop, while Tableau Prep Conductor automates flow execution on Tableau Server or Cloud on scheduled intervals, maintaining prepared data freshness without manual intervention.
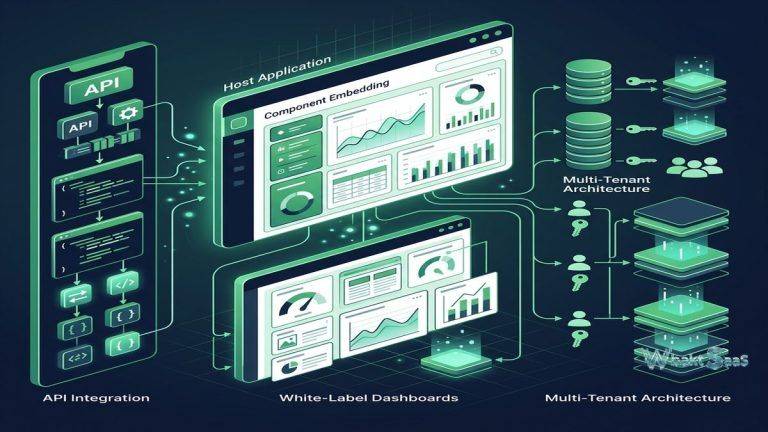
Embedded Analytics
Tableau’s embedded analytics capabilities enable integrating interactive visualizations into external applications, portals, and websites. The JavaScript API provides comprehensive programmatic control over embedded visualizations, enabling host applications to interact with Tableau content — filtering data, selecting marks, and responding to user interactions. Connected Apps provide secure, seamless, and trustworthy authentication for embedded content. Embedded analytics extends Tableau’s visual analytics capabilities to custom application interfaces, customer portals, and partner platforms where users interact with data-driven insights within the context of other business applications rather than navigating to a separate analytics platform.
Community and Ecosystem
Tableau’s community ecosystem includes Tableau Public (free platform for public data visualizations), community forums, user groups, and the annual Tableau Conference. Tableau Public hosts millions of freely available public visualizations that serve as inspiration, learning resources, and reusable templates. The Tableau Exchange marketplace provides pre-built extensions, accelerators, and connectors that extend platform functionality. Training resources include free online training through Tableau eLearning, certification programs for Desktop Specialist, Data Analyst, and Server Certified Associate credentials, and an extensive library of community-created educational content.
Governance and Security
Tableau provides data governance through content certification that identifies trusted, verified data sources and dashboards. Row-level security restricts data visibility based on user identity, ensuring that users see only the data they are authorized to access. Permission models control content access at the project, workbook, and view level. Activity logging tracks user interactions, content access, and important system events for security monitoring and usage analysis. Data management features including Tableau Catalog provide lineage tracking that shows how data flows from sources through preparations into published visualizations, enabling impact analysis when data sources change.
Mobile Analytics
Tableau Mobile provides native iOS and Android applications for accessing dashboards and visualizations on smartphones and tablets. Mobile-optimized layouts automatically adapt dashboard designs for smaller screen sizes while maintaining interactive capabilities including filtering, drilling, and tooltip exploration. Offline access enables viewing previously loaded dashboards without network connectivity — critical for field workers, traveling executives, and situations where connectivity is unreliable. Push notifications alert users when data thresholds are triggered or subscribed dashboards are refreshed. The mobile experience extends Tableau’s analytics reach beyond desk-bound users to decision makers who need data insights wherever they are working.
Performance Optimization
Tableau provides performance optimization tools including the Performance Recorder that identifies slow-performing queries and visualizations, enabling targeted optimization. Data engine (Hyper) provides high-performance analytical processing for extracted data with columnar storage, data compression, and parallel query execution. Query caching reduces redundant database queries by serving previously computed results. Materialized views pre-compute common analytical aggregations for faster dashboard loading. For organizations analyzing large datasets — millions or billions of records — performance optimization through extract design, query optimization, and visualization simplification ensures responsive analytical experiences that keep users engaged with data exploration.
Data Stories
Tableau Stories enable creating guided analytical narratives that walk viewers through data insights sequentially. Stories combine visualizations, annotations, and text into presentation-style sequences that communicate analytical findings with context, interpretation, and recommended actions. Each story point captures a specific visualization state with descriptive text, enabling analysts to build compelling data-driven narratives for stakeholder presentations, board reports, and strategic planning sessions. The story format transforms exploratory analysis into structured communication that guides viewers through complex analytical findings step by step.
Collaboration Features
Tableau enables collaborative analytics through commenting on published dashboards, shared data sources, and collaborative content development. Users add comments to specific data points, visualizations, and dashboards to share observations, questions, and interpretive context. Shared published data sources create consistent analytical foundations that multiple authors can build upon, ensuring that different dashboards and analyses reference the same data definitions and calculations. Web authoring on Tableau Server and Cloud enables creating and editing visualizations directly in the browser without requiring desktop software installation.
Extensions and Integrations
Dashboard extensions enable embedding third-party functionality within Tableau dashboards — including write-back capabilities, advanced statistical visualizations, custom charts, planning tools, and integration with external applications. The Extensions API provides a framework for building custom dashboard extensions using web technologies. Tableau integrates with data science tools including Python (TabPy) and R for advanced statistical modeling, machine learning predictions, and custom analytical computations within Tableau calculations. Salesforce integration provides native connectivity to Salesforce CRM data with Einstein AI-powered analytics recommendations.
Common Use Cases
Executive Dashboards: Organizations create interactive executive dashboards that provide real-time visibility into key performance indicators, financial metrics, operational performance, and strategic initiative progress for C-suite leadership decision-making and board reporting.
Sales Analytics: Sales organizations analyze pipeline performance, territory distribution, win/loss patterns, customer segmentation, quota attainment, and revenue forecasting through interactive visualizations that enable drill-down from summary metrics to individual deal-level details.
Financial Reporting: Finance teams create dynamic financial dashboards covering revenue analysis, expense tracking, budget variance analysis, cash flow modeling, profitability analysis, and financial forecasting with interactive filtering across time periods, departments, and cost centers.
Healthcare Analytics: Healthcare organizations analyze patient outcomes, clinical performance metrics, resource utilization, population health trends, readmission rates, and operational efficiency through HIPAA-compliant analytics deployments on Tableau Server.
Marketing Analytics: Marketing teams visualize multi-channel campaign performance, customer acquisition costs, attribution modeling, conversion funnel analysis, customer lifetime value calculations, and competitive positioning across integrated marketing data sources.
Supply Chain: Operations teams monitor end-to-end supply chain performance including inventory optimization, delivery time analysis, supplier scorecards, logistics routing efficiency, demand forecasting, and quality metrics through geographic and temporal visualizations.
Education: Educational institutions analyze student performance, enrollment trends, graduation rates, resource allocation, and institutional effectiveness through dashboards that support data-driven academic and administrative decision-making.
Pricing
Tableau offers Creator, Explorer, and Viewer license tiers with different capability levels. Creator licenses include Tableau Desktop, Tableau Prep, and Server/Cloud access for full authoring capabilities. Explorer licenses provide web-based authoring and exploration. Viewer licenses provide dashboard viewing and interaction. Tableau Cloud pricing is per-user per month. Tableau Server requires on-premises infrastructure plus user licensing. Tableau Public is free for creating and publishing public visualizations.
Pricing varies by deployment type and user count. Please verify current pricing on the official Tableau website before making purchasing decisions.
Limitations
- Cost: Tableau’s per-user licensing model can become expensive for large-scale enterprise deployments, particularly when providing analytics access to a broad user base beyond core analysts.
- Learning curve: While the interface is visual, creating sophisticated analytical calculations and LOD expressions, complex dashboard interactivity, and effective data modeling requires significant learning investment.
- Data preparation: Complex data preparation may still require external ETL tools or database-level processing beyond what Tableau Prep provides for enterprise data pipeline requirements.
- Write-back: Tableau is primarily designed as a read-only analytical tool that does not natively support data entry, form submission, or write-back to source systems.
- Real-time streaming: While live connections provide reasonably current data, true real-time streaming visualization for high-frequency data requires additional configuration and may face performance constraints.
Summary
Tableau provides the visual analytics platform that established and defined the modern business intelligence category, transforming data analysis from a technical specialty into an accessible business activity through its intuitive drag-and-drop interface, powerful VizQL query engine, and comprehensive data connectivity. The platform enables business users, analysts, and data scientists to explore data visually, create interactive dashboards, and communicate insights through compelling data visualizations without requiring programming expertise.
Tableau’s significant deployment flexibility — Desktop for individual analysis, Server for on-premises enterprise deployment, Cloud for managed hosting — enables organizations to match their analytics infrastructure to their technical capabilities and data governance requirements. The Salesforce integration ecosystem continues expanding Tableau’s reach into CRM-driven analytics.
Business intelligence platforms including Tableau, Power BI, Looker, Qlik Sense, and Metabase each serve different analytics philosophies, deployment models, and pricing structures. Tableau’s advantages center on visual analytics depth, data source connectivity breadth, interactive dashboard capabilities, community ecosystem strength, and the self-service analytics approach that empowers business users to explore data independently. Organizations evaluating BI platforms should carefully consider their analytical complexity requirements, user base size, existing technology investments, and budget constraints when comparing analytics tools.
Features, pricing, and availability discussed in this review reflect information available at the time of writing. Software products evolve continuously, and details may have changed since publication. Please verify current information directly on the official Tableau website. WBAKT SaaS is an independent review platform with no affiliate relationships with any software company mentioned in this article.
For related analytics tools, see our reviews of Power BI, Looker, and Qlik Sense.