The rapidly growing demand for embedded analytics — integrating data visualizations and analytical capabilities directly into business applications, customer portals, and operational workflows — has grown significantly as organizations recognize that standalone business intelligence tools create significant friction when analytics exist separately from the applications where users work and make decisions. Traditional BI platforms were originally designed for dedicated analytics environments where users navigate to a completely separate application to explore data, but modern business requirements increasingly and urgently call for contextual analytics that appear within the applications users already use throughout their workday. Sisense directly addresses this embedded analytics opportunity with a platform specifically designed for building analytics into applications, products, and workflows — providing the robust infrastructure, APIs, and customization capabilities that product teams and developers need to create seamless, white-labeled analytical experiences.
Founded in 2004 in Israel by Amit Bendov and Eldad Farkash, Sisense initially gained significant recognition for its In-Chip technology that enabled querying large datasets on commodity hardware through aggressive data compression, memory optimization, and CPU cache utilization. the platform has evolved from a traditional BI tool into a comprehensive analytics platform focused on embedded and API-driven analytics, culminating in the Sisense Fusion platform that combines cloud-native architecture with the embedded analytics capabilities that differentiate Sisense from more visualization-focused BI competitors. Understanding Sisense’s embedded analytics architecture, comprehensive data handling, and customization capabilities helps organizations evaluate whether this developer-friendly analytics platform meets their requirements for building analytics-powered applications and products or whether more traditional BI platforms better serve standalone and self-service analytical needs.
Sisense Fusion Platform
Sisense Fusion provides a cloud-native analytics platform that combines data preparation, modeling, visualization, and embedded analytics into an integrated architecture. The platform flexibly supports deployment on Sisense-managed cloud, customer-managed cloud (AWS, Azure, GCP), and on-premises infrastructure. Multi-tenant architecture enables serving analytics securely to multiple customer segments with isolated data access from shared infrastructure. The Fusion platform represents Sisense’s significant evolution from desktop-installed BI software to a modern cloud platform, incorporating microservices architecture, Kubernetes orchestration, API-first design principles, and cloud-native scalability that align with contemporary software development practices.
Data Handling and Elasticube
Elasticube is Sisense’s powerful proprietary data storage and query engine that imports, compresses, and indexes data for fast analytical querying. The columnar storage model combined with aggressive data compression enables querying datasets that would typically require dedicated data warehouse infrastructure. Elasticube supports importing data from databases, files, APIs, and numerous cloud applications with scheduled refresh for data currency. Live model connectivity enables querying external databases directly without importing data, supporting real-time analytical requirements. The flexible hybrid approach — importing data for performance and connecting live for freshness — enables organizations to optimize their data strategy for different analytical scenarios and requirements within the same platform.
Data Modeling
Sisense’s data modeling interface enables defining table relationships, creating calculated fields, and building analytical data structures through a visual schema designer. Relationship definitions establish joins between tables and data sources for multi-table analytical queries. Calculated fields create derived dimensions and measures using Sisense’s formula language. Custom tables create analytical views from SQL queries, expressions, or calculated fields. For organizations building embedded analytics experiences, data models define the analytical foundations that drive dashboard visualizations and API-delivered metrics — making model design a critically important architectural decision that impacts analytical accuracy, query performance, and user experience.
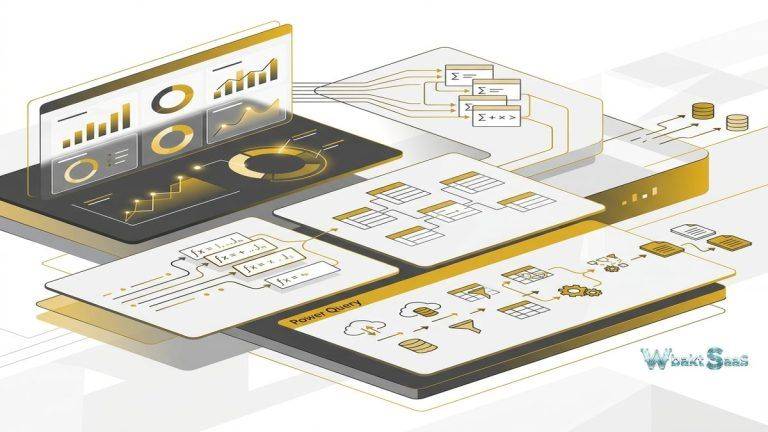
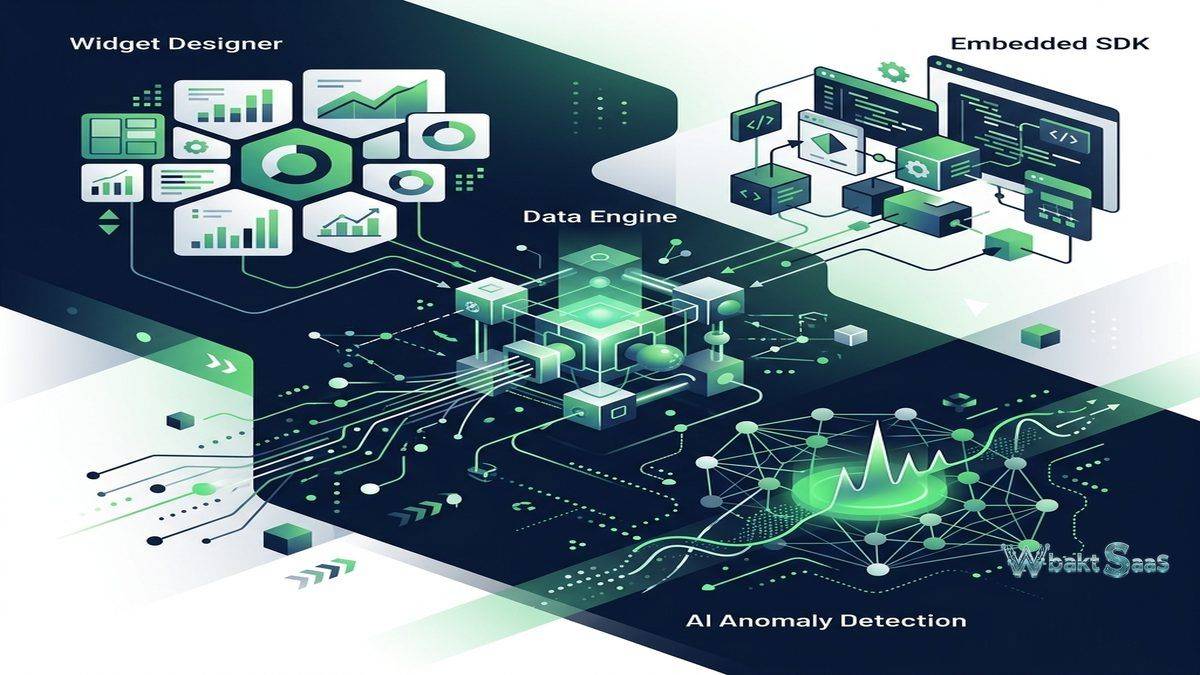
Dashboard and Widget Designer
Sisense dashboards combine widgets (individual visualizations) into interactive analytical displays. Widget types include a comprehensive set of standard charts (bar, line, area, pie, scatter), tables, pivot tables, maps, indicators, gauges, and specialized visualizations. The widget designer provides intuitive WYSIWYG configuration with drag-and-drop field assignment, filter configuration, and formatting controls. Dashboard filters apply across all widgets for coordinated and consistent analytical interaction. JavaScript-based customization enables advanced interactivity, custom styling, event handling, and integration logic that extends beyond standard configuration options. For embedded analytics scenarios, dashboards serve as the primary visual containers that host analytical content within external applications.
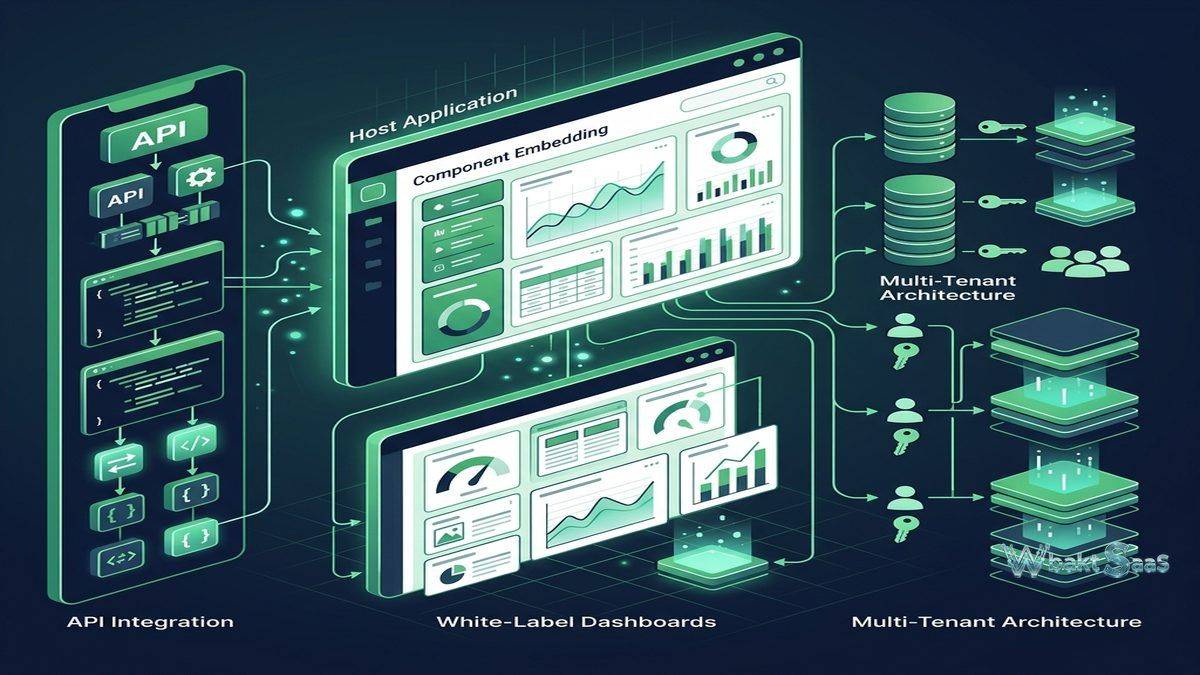
Embedded Analytics SDK
Sisense’s Embed SDK provides comprehensive tools for integrating analytics into external applications. iFrame embedding provides simple integration with minimal development effort required. The JavaScript SDK provides comprehensive programmatic control over embedded content including filtering, theming, event handling, and content selection. SSO integration enables seamless and secure authentication between host applications and embedded Sisense content. Multi-tenancy support ensures strict data isolation between different customers accessing embedded analytics. The Compose SDK provides component-level embedding using React, Angular, and Vue frameworks — enabling developers to build custom analytical interfaces using Sisense data and query capabilities without using Sisense’s dashboard UI, creating fully custom and branded analytical experiences that are indistinguishable from native application features.
API-First Architecture
Sisense provides extensive REST APIs that expose platform capabilities for programmatic access and integration. Query APIs execute analytical queries against data models directly and return structured results for consumption by custom applications. Dashboard APIs manage dashboard content programmatically. User and group management APIs automate provisioning and access control. Data model APIs enable programmatic model management and configuration. The API-first approach enables developers to use Sisense as an analytical backend that powers custom frontend experiences, automated reporting, data-driven application features, and integration with organizational workflows and systems.
AI and Machine Learning
Sisense incorporates AI capabilities through natural language querying that enables users to ask questions in plain language and receive visualizations. Automated insights identify patterns, trends, anomalies, and correlations in data without explicit analytical configuration. Forecast models predict future metric values based on historical trends. The AI integration aims to significantly reduce the analytical expertise required for data exploration by automating insight generation. For embedded analytics scenarios, AI capabilities enable providing intelligent, proactive insights within applications — surfacing relevant data patterns to users who may not actively explore dashboards but benefit from automated analytical observations.
White-Label Customization
Sisense provides extensive white-label customization for embedded analytics deployments. Theme customization controls colors, fonts, layouts, and visual styling to match host application branding. custom login pages, email templates, and notifications all maintain brand consistency throughout the user experience. CSS and JavaScript customization provides exceptionally fine-grained control over visual presentation and interactive behavior. For SaaS companies and service providers embedding analytics into their products, white-label capabilities ensure that analytical features appear as native product functionality rather than externally sourced and visually disconnected embedded content — maintaining brand integrity and user experience continuity.
Security and Governance
Sisense implements data security through row-level security that restricts data visibility based on user identity and attributes. Data access rules precisely define which data subsets each user or tenant can access, enforced consistently across dashboards, widgets, and API queries. SSO support includes SAML, OAuth 2.0, OpenID Connect, and JWT authentication protocols. Audit logging records all user activities for security monitoring and compliance documentation. SOC 2 Type II compliance provides independent third-party validation of security controls. For multi-tenant embedded analytics where different customers access shared infrastructure but must see only their own data, Sisense’s security model provides the isolation guarantees that embedded analytics deployments require.
Scalability and Performance
Sisense’s architecture supports horizontal scaling through load-balanced query processing and distributed data handling. Build nodes handle data import and processing workloads, while query nodes serve analytical queries — enabling independent scaling of data preparation and query serving workloads. Intelligent Intelligent query caching reduces redundant query execution for frequently accessed dashboards. For embedded analytics scenarios where hundreds or thousands of external users access analytical content simultaneously, scalable architecture ensures responsive performance under production load conditions that significantly exceed typical internal BI usage patterns.
Notebooks and Code-Based Analytics
Sisense provides notebook-based analytical environments that enable data analysts and scientists to execute Python and R code against Sisense data models. Notebooks support exploratory data analysis, statistical modeling, machine learning model development, and custom analytical computations within the Sisense platform. Results from notebook analyses can be published as dashboard widgets, creating a bridge between code-based advanced analytics and visual dashboard consumption by business users. For organizations with data science capabilities, notebooks enable extending Sisense’s analytical depth beyond standard visualization and dashboard capabilities into custom statistical and predictive analytical territory.
Data Connectors
Sisense connects to a broad range of data sources including relational databases (MySQL, PostgreSQL, SQL Server, Oracle), cloud data warehouses (Snowflake, BigQuery, Redshift, Databricks), cloud applications (Salesforce, Google Analytics, HubSpot, Jira), files (CSV, Excel, JSON), and custom REST API endpoints. The flexible connector framework supports both import mode (data stored in Elasticube) and live mode (queries executed against source databases in real-time). Custom connector development extends connectivity to proprietary and specialized data sources not covered by built-in connectors. For embedded analytics scenarios in particular, connector breadth determines how effectively the platform can integrate data from the diverse data sources that different customers and use cases require.
Alerting and Pulse
Sisense Pulse provides AI-powered monitoring that automatically detects anomalies and significant changes in analytical data without requiring manual threshold configuration. Pulse continuously analyzes data patterns and notifies users when metric values deviate significantly from expected ranges. Traditional threshold-based alerts complement Pulse with user-defined rules that trigger notifications when specific conditions are met. Alert delivery through email, Slack, webhooks, mobile push notifications, and other channels ensures that critical data changes reach responsible stakeholders through their preferred communication channels. For proactive monitoring scenarios, the combination of AI-driven anomaly detection and rule-based alerting provides truly comprehensive data surveillance.
Mobile Analytics
Sisense provides mobile access through responsive web design and native mobile applications for iOS and Android. Mobile-optimized dashboards automatically adapt layouts for smaller screens while maintaining interactive capabilities including filtering, drilling, and tooltip exploration. For embedded analytics scenarios, mobile-responsive embedded content ensures that analytical features function properly when host applications are accessed from mobile devices. The mobile experience extends Sisense’s analytics reach to users who need data insights beyond desktop environments — field workers, traveling executives, and mobile-primary users accessing embedded analytics within mobile applications and portals.
Plugin Marketplace
The Sisense Marketplace provides pre-built plugins, connectors, widgets, and add-ons that extend platform capabilities. Plugin categories include custom visualization widgets, data connectors, action plugins, AI extensions,, and analytical extensions. The open plugin architecture enables community and third-party partner contributions alongside Sisense-developed extensions. For organizations with specialized requirements — industry-specific visualizations, proprietary data source integration, or custom workflow automation — the marketplace provides valuable extensibility that addresses needs beyond core platform capabilities without custom development from scratch.
Common Use Cases
Product Analytics Embedding: SaaS companies embed Sisense analytics into their products to provide customers with self-service data exploration, usage dashboards, performance monitoring, ROI reporting, and business intelligence capabilities within the application context using Compose SDK for fully native and branded experiences.
Customer-Facing Portals: Service providers create customer portals with embedded analytics that show clients performance metrics, usage data, ROI calculations, trend analysis, and operational insights — transforming data transparency from a manual reporting process into a self-service customer experience.
Internal Enterprise BI: Large organizations use Sisense for internal business intelligence across departments, providing interactive dashboards for sales analytics, financial reporting, operational monitoring, HR analytics, and executive decision support with row-level security ensuring data access appropriateness.
OEM Analytics: Technology companies integrate Sisense as the analytics engine within their products, using white-label customization and multi-tenant architecture to provide analytics capabilities to their end customers under the product’s own branding and design language.
Healthcare Analytics: Healthcare organizations deploy Sisense for clinical analytics, patient outcome monitoring, operational efficiency tracking, quality measure reporting, and regulatory compliance reporting with data security controls that support HIPAA compliance requirements.
Financial Services: Financial institutions use Sisense for portfolio analytics, risk dashboards, regulatory reporting, customer analytics, and fraud detection with the security architecture, audit capabilities, and compliance controls that regulated financial environments require.
IoT and Operations: Manufacturing and industrial organizations use Sisense for analyzing IoT sensor data, equipment performance monitoring, predictive maintenance analytics, and operational efficiency tracking through dashboards that process high-volume time-series data from connected devices.
Pricing
Sisense pricing is available through sales engagement with costs based on deployment model, user count, and feature requirements. Plans include options for internal analytics, embedded analytics, and enterprise deployments. Pricing varies significantly based on embedded analytics scale and multi-tenant requirements.
Contact Sisense sales for current pricing details and deployment options.
Limitations
- Self-service complexity: While Sisense excels at embedded and developer-driven analytics, the self-service experience for non-technical business users is less refined than purpose-built self-service platforms like Tableau.
- Pricing transparency: Enterprise pricing through sales engagement without public pricing creates evaluation difficulty during initial comparison and budgeting phases.
- Community ecosystem: Sisense’s community and third-party ecosystem is smaller than Tableau or Power BI, providing fewer pre-built resources, templates, and community support.
- Visualization depth: Standard visualization capabilities are adequate but less extensive than dedicated visualization platforms for highly specialized analytical display requirements.
- Platform complexity: The breadth of capabilities across embedding, APIs, data modeling, and customization creates a learning curve for teams new to embedded analytics development.
Summary
Sisense provides a specialized embedded analytics platform that addresses the growing demand for integrating analytical capabilities directly into business applications, customer products, and operational workflows. The Compose SDK, API-first architecture, extensive white-label customization, and multi-tenant security model create a developer-friendly platform for building analytics-powered application features that appear and function as native product capabilities rather than externally embedded BI tools.
The powerful Elasticube data engine provides query performance through compression and in-memory processing, while live model connectivity supports real-time analytical requirements. Sisense Fusion’s modern cloud-native architecture provides deployment flexibility across managed cloud, customer cloud, and on-premises environments, accommodating diverse infrastructure policies and regulatory requirements. The notebook integration bridges data science capabilities with business-user-facing dashboards, enabling advanced analytical workflows alongside standard visualization.
The developer experience represents one of Sisense’s strongest differentiators in the analytics market. The Compose SDK’s component-level embedding enables building analytical interfaces using React, Angular, and Vue frameworks that are completely integrated into host applications — far beyond the dashboard-level iframe embedding that many platforms offer. The extensive REST API coverage means that virtually every platform capability can be automated, integrated, and customized programmatically, treating Sisense as analytical infrastructure rather than a standalone tool.
Embedded analytics platforms including Sisense, Looker, Domo, and Tableau Embedded each approach application-integrated analytics with different architectural emphases and capabilities. Sisense’s key advantages center on component-level embedding through Compose SDK, extensive API coverage, white-label depth, multi-tenant architecture, AI-powered anomaly detection through Pulse, and the developer-friendly approach that treats analytics as application infrastructure rather than standalone tools. Organizations evaluating embedded analytics should carefully consider their development team capabilities, embedding depth requirements, multi-tenant needs, and the importance of custom analytical experiences versus standard dashboard embedding when comparing analytics platform options.
Features, pricing, and availability discussed in this review reflect information available at the time of writing. Software products evolve continuously, and details may have changed since publication. Please verify current information directly on the official Sisense website. WBAKT SaaS is an independent review platform with no affiliate relationships with any software company mentioned in this article.
For related analytics tools, see our reviews of Looker, Domo, and Tableau.