Traditional business intelligence platforms have struggled with a fundamental architectural challenge — the tension between analyst productivity and organizational data governance. Self-service analytics tools empower individual business analysts to create visualizations quickly but often produce inconsistent metric definitions, duplicated logic, and ungoverned data interpretations across the organization. Centralized BI platforms enforce data consistency but create bottlenecks where analysts wait for IT teams to build reports. Looker effectively resolves this tension through a unique semantic modeling layer called LookML that defines business metrics, calculations, and relationships in code — creating a governed, version-controlled, and authoritative layer of business logic that all users and applications reference consistently while maintaining the flexibility for self-service data exploration and visualization creation.
Founded in 2012 by Lloyd Tabb and Ben Porterfield, Looker was built on the philosophy that modern analytics should leverage the power of cloud data warehouses rather than extracting data into proprietary analytical engines. The platform dynamically generates optimized SQL queries against cloud data warehouses (BigQuery, Snowflake, Redshift, Databricks), keeping data securely in place and leveraging the massive computational capacity that modern cloud databases provide. Google acquired Looker in 2020 for $2.6 billion, integrating it into the Google Cloud Platform as the enterprise business intelligence and analytics component. The acquisition strategically positioned Looker as Google Cloud’s enterprise analytics platform, deepening integration with BigQuery, Vertex AI, and Google Cloud infrastructure. Understanding Looker’s semantic modeling approach, data exploration capabilities, and Google Cloud integration helps organizations evaluate whether this governance-first analytics platform meets their business intelligence requirements.
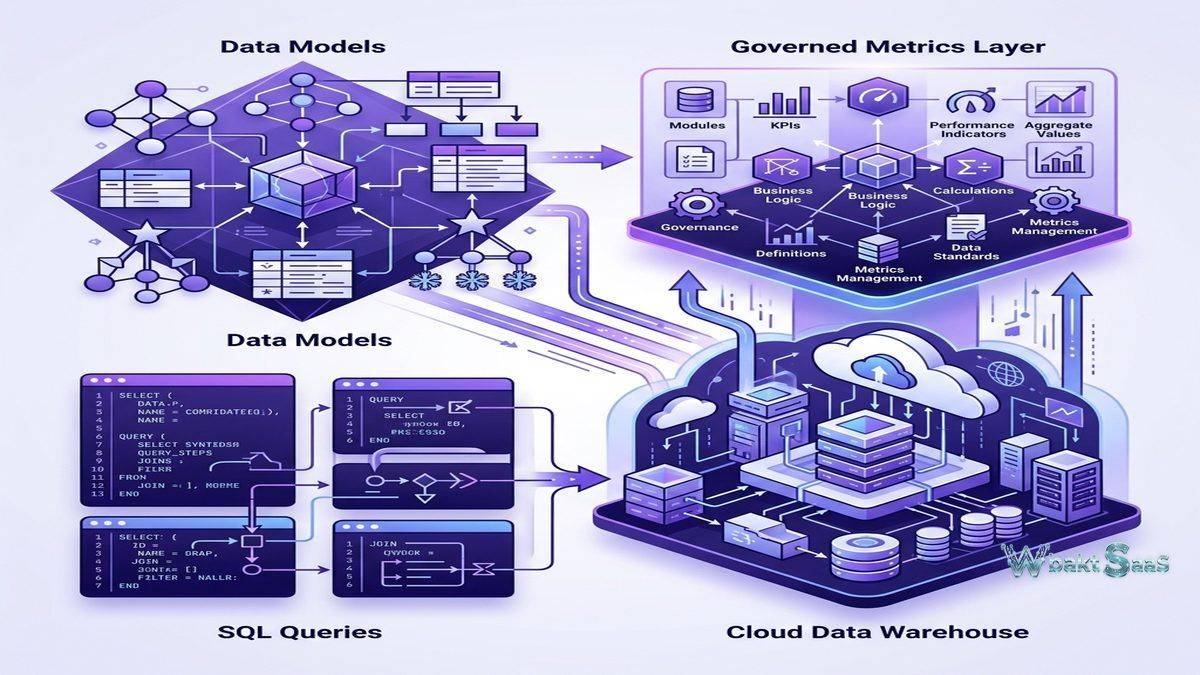
LookML Semantic Layer
LookML (Looker Modeling Language) is Looker’s purpose-built proprietary modeling language that defines data models, dimensions, measures, relationships, and business logic in version-controlled code files. Unlike the drag-and-drop data modeling approach in other BI platforms, LookML provides a code-based approach where data engineers and analysts define how raw database tables translate into business-meaningful concepts. Dimensions define descriptive data attributes (customer name, product category, geographic region). Measures define analytical aggregations (revenue sum, average order value, count of transactions). Derived tables create powerful virtual tables from SQL queries or LookML definitions. The LookML model serves as a single source of truth — every report, dashboard, and data exploration across the organization references the same metric definitions, eliminating the inconsistency that plagues organizations where each analyst independently defines business metrics.
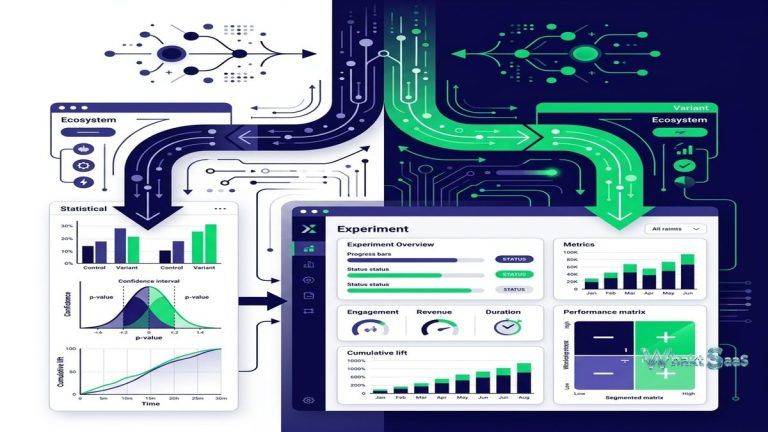
Explores
Explores provide Looker’s self-service data exploration interface where business users query data through LookML-defined models without writing SQL. Business users select dimensions and measures from the LookML model, apply filters, and Looker generates optimized SQL queries that execute against the underlying cloud data warehouse. The Explore interface provides pivot tables, visualization creation, custom filtering, and drill-down exploration — all operating within the governed framework that LookML defines. Business users explore data freely while the LookML layer ensures that metric calculations, join logic, and data access controls remain consistent regardless of which user is querying or how they are slicing the data.
Dashboards
Looker dashboards combine multiple visualizations, filters, and text elements into interactive analytical displays. Dashboard filters apply across all tiles simultaneously and consistently, creating coordinated analytical views. Cross-filtering enables selecting data in one tile to filter other tiles on the same dashboard. Dashboard scheduling automatically delivers snapshots via email or Slack on configured intervals. Dashboard alerts trigger notifications when metric values cross defined thresholds, enabling proactive monitoring without manual dashboard checking. LookML dashboards define dashboard configurations in code, enabling version control, templating, and programmatic dashboard management alongside visual dashboard creation through the web interface.
Google Cloud Integration
Looker integrates deeply with Google Cloud Platform services. BigQuery connectivity provides optimized performance for Google’s serverless data warehouse, leveraging BigQuery’s massive parallel processing for analytical queries. Looker Studio integration enables creating Looker-powered visualizations within the Google Workspace ecosystem. Vertex AI integration seamlessly connects machine learning models to Looker’s analytical layer, enabling predictive analytics within business dashboards. Google Sheets export enables delivering analytical results to spreadsheet-comfortable users. Cloud Identity and IAM integration provides unified access management across Google Cloud services. For organizations building their data infrastructure on Google Cloud, Looker provides native analytics capabilities that leverage Google Cloud’s computational and AI resources.
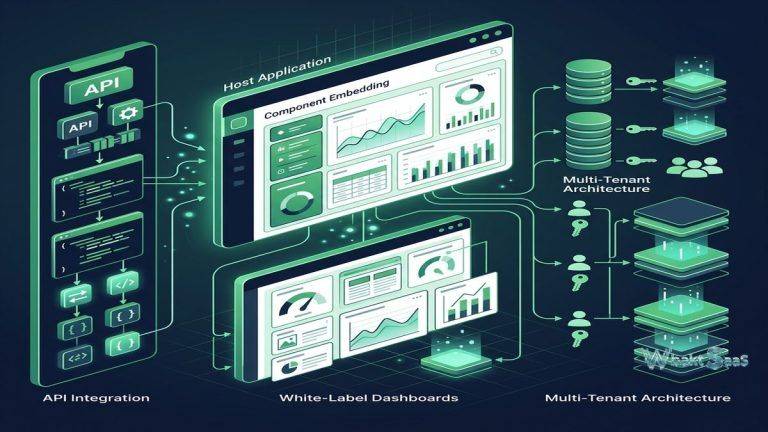
Embedded Analytics
Looker provides extensive embedded analytics capabilities for integrating data visualizations and exploration into external applications, customer portals, and partner platforms. The Embed SDK provides comprehensive programmatic control over embedded content including filtering, theming, and user interaction handling. Single Sign-On (SSO) embedding provides seamless authentication that integrates with the host application’s identity management. Looker’s API-first architecture means that every platform capability is accessible through REST APIs, enabling programmatic data access, report generation, content management, and administration. For SaaS companies providing analytics to their customers, Looker’s embedded analytics creates data-driven product features without building analytics infrastructure from scratch.
Actions and Integrations
Looker Actions enable triggering business processes directly from analytical results — sending data to Slack channels, creating Jira tickets, updating Google Sheets, triggering webhooks, and pushing data to downstream applications. The Action Hub provides pre-built integrations and connectors with common business tools. Custom actions enable organizations to build entirely proprietary integrations that connect Looker insights to internal systems and processes. Actions transform analytics from passive reporting into active business intelligence that drives immediate operational responses from data findings rather than requiring users to export data and manually initiate follow-up processes in other systems.
Data Governance
Looker’s governance model centers on the LookML layer as the authoritative definition of business metrics and data access controls. Content validation ensures that dashboards and Explores always reference valid LookML definitions, preventing broken content when data models change. Access control operates at multiple levels — model access determines which data models users can explore, row-level security restricts data visibility based on user attributes, and content access controls who can view, edit, and manage dashboards and folders. The code-based nature of LookML enables version control through Git integration, providing change history, code review workflows, and the ability to roll back problematic changes — bringing software development governance practices to business intelligence.
Derived Tables and PDTs
Derived tables create virtual analytical views from SQL queries or LookML aggregate definitions without modifying the underlying database schema. Persistent Derived Tables (PDTs) materialize derived table results into the data warehouse on configured schedules, pre-computing complex transformations for faster query performance. Aggregate awareness intelligently routes queries to the most appropriate aggregation level, using PDTs for summary queries and base tables for detail queries. For organizations with complex analytical requirements that span multiple database tables with intricate join logic, derived tables provide an analytical abstraction layer that simplifies business user experience while handling complex data architecture underneath.
System Activity and Monitoring
Looker provides system activity dashboards that monitor platform usage, query performance, content consumption, and user adoption. Query performance monitoring identifies slow queries, frequently executed queries, and resource-intensive operations that may need optimization. Content usage analytics show which dashboards and Explores are most valuable, supporting content governance decisions about maintenance, promotion, and retirement. API usage monitoring tracks programmatic platform access. For organizations managing Looker as a shared analytics service, system monitoring provides the operational visibility needed to optimize performance, manage capacity, and demonstrate analytics platform value to stakeholders.
Scheduling and Distribution
Looker enables scheduling dashboards and Looks for automated delivery through email, Slack, Amazon S3, Google Cloud Storage, SFTP, and webhook destinations. Scheduled deliveries run queries on configured intervals, generating fresh analytical content without manual intervention. Conditional delivery filters distributions based on data conditions — for example, sending alerts only when specific metrics exceed thresholds rather than sending routine reports regardless of data state. For organizations distributing analytics to users who don’t regularly log into the Looker platform, scheduled delivery ensures that critical business insights reach decision-makers through their preferred communication channels on a consistent, automated basis.
Content Management
Looker organizes analytical content in folders with hierarchical permission structures. Personal folders provide private analytical workspaces. Shared folders enable team-based content organization with controlled access. Content validation automatically identifies broken dashboards, invalid field references, and orphaned content that no longer connects to active LookML models. Content search enables discovering relevant dashboards, Looks, and Explores across the organizational content library. Board views aggregate related content into curated collection pages for specific audiences or analytical domains. The content management system provides the organizational structure needed to maintain analytical content quality as the volume of dashboards, Looks, and Explores grows with platform adoption.
Developer Workflow
Looker’s developer workflow integrates Git version control with LookML development. The IDE (Integrated Development Environment) provides browser-based LookML editing with syntax highlighting, autocomplete, and validation. Branching enables developers to create isolated development branches for testing model changes without affecting production content. Pull requests enable code review of LookML changes before merging into the production branch. The SQL Runner provides direct SQL access to connected databases for query testing and data exploration during model development. This software development approach to analytics governance — version control, branching, code review, and automated validation — brings engineering discipline to business intelligence management that dashboard-based platforms cannot replicate.
Data Delivery and Actions
Beyond visualization and exploration, Looker enables delivering analytical results to external systems through data delivery integrations and Actions. Data can be sent to Google Sheets for spreadsheet-based analysis, to Amazon S3 or Google Cloud Storage for data pipeline consumption, to Slack channels for team communication, and to custom webhook endpoints for integration with proprietary systems. Data actions enable users to take business actions directly from analytical results — creating CRM records, updating database tables, triggering marketing campaigns, and initiating operational processes based on data discoveries. This action-oriented approach transforms analytics from a passive reporting activity into an active operational tool.
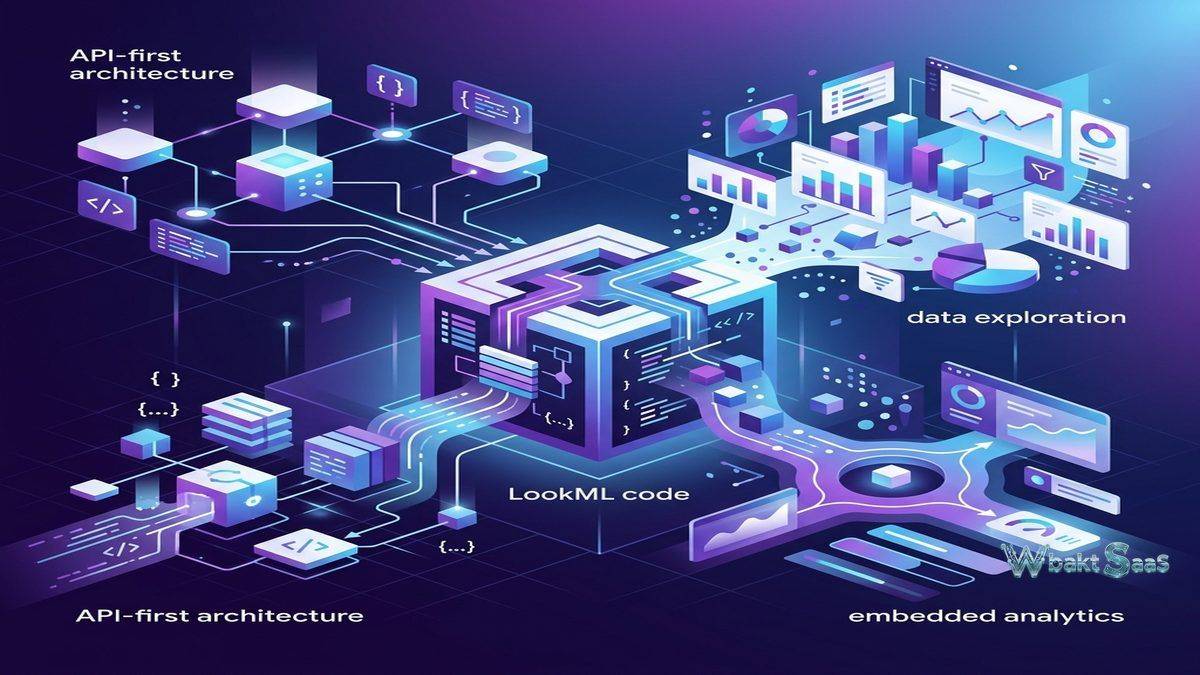
Universal Semantic Model
Looker’s semantic model approach extends beyond visualization to provide a universal data access layer. Applications, reports, embedded analytics, and API consumers all query through the same LookML model, ensuring consistent metric definitions regardless of the access method. The Looker API enables programmatic data retrieval using LookML model definitions, providing consistent metrics to custom applications, data pipelines, and automated processes. This universal semantic layer differentiates Looker from visualization-focused BI platforms where metric definitions exist within individual reports rather than in a shared, governed model that serves all data consumers across the organization.
Alerts and Monitoring
Looker alerts enable configuring threshold-based notifications on dashboard tiles. When metric values cross defined boundaries — revenue dropping below targets, error rates exceeding thresholds, inventory levels reaching reorder points — alerts automatically notify relevant stakeholders through email, Slack, or other configured channels. Alert conditions support comparison operators, percentage changes, and absolute value thresholds. For operational monitoring where proactive notification is more valuable than periodic dashboard review, alerts convert passive analytics into active monitoring that drives timely business responses to changing conditions.
Common Use Cases
Enterprise BI: Large organizations use Looker’s governed semantic layer to provide consistent, trustworthy business metrics across all departments, ensuring that finance, sales, marketing, operations, and executive leadership all reference the same metric definitions when analyzing organizational performance and making strategic decisions.
Product Analytics: SaaS companies use Looker to analyze product usage, feature adoption, user engagement, conversion funnels, retention cohorts, and growth metrics with data from application databases and event tracking platforms, often embedding analytics directly into their product interfaces for customer self-service.
Customer-Facing Analytics: Software platforms embed Looker visualizations and exploration capabilities into their products, providing customers with powerful self-service analytics over their own data within the application context using Looker’s robust embedded analytics infrastructure and SSO authentication.
Marketing Analytics: Marketing teams analyze multi-channel campaign performance, attribution modeling, customer acquisition costs, lifecycle marketing effectiveness, and return on marketing investment using Looker’s ability to combine data from multiple marketing platforms through the unified LookML semantic layer.
Healthcare: Healthcare organizations use Looker for clinical outcome analytics, operational performance monitoring, population health analysis, quality measure reporting, and regulatory compliance reporting with governed data models that enforce HIPAA compliance and ensure consistent metric definitions across clinical departments.
Financial Services: Financial institutions use Looker for risk analytics, portfolio performance monitoring, regulatory capital reporting, customer analytics, and fraud detection with the data governance, audit trail, and access control capabilities that highly regulated financial environments require.
E-Commerce: Online retailers use Looker for analyzing purchasing patterns, product performance, customer segmentation, inventory optimization, and conversion funnel analysis across web analytics, order management, and customer data platforms.
Pricing
Looker pricing is based on platform edition and user count, with Standard, Enterprise, and Embed editions providing increasing capabilities. Pricing is available through Google Cloud sales engagement rather than public self-service pricing. Looker is often bundled with Google Cloud commitments. Looker Studio (formerly Google Data Studio) provides free visualization capabilities with more limited data modeling and governance features.
Contact Google Cloud sales for current Looker pricing and licensing details.
Limitations
- Learning curve: LookML requires learning a proprietary modeling language, creating an adoption barrier for organizations without technical resources to build and maintain data models.
- Cloud warehouse dependency: Looker’s architecture fundamentally requires a cloud data warehouse, adding infrastructure cost and complexity for organizations that don’t already operate one.
- Visualization depth: While Looker provides standard visualization types, its overall visualization capabilities are less extensive than Tableau’s chart variety and customization options.
- Pricing transparency: Enterprise pricing through sales engagement rather than public pricing makes cost evaluation difficult during initial platform comparison.
- Google Cloud alignment: While Looker supports multiple databases, its deepest integration advantages favor Google Cloud environments, potentially creating some platform bias.
Summary
Looker provides a governance-first analytics platform that addresses the fundamental BI challenge of balancing self-service flexibility with organizational data consistency through its unique LookML semantic modeling layer. By defining business metrics, calculations, and data relationships in version-controlled code, Looker creates a single source of truth that ensures every user, dashboard, and embedded analytics application references the same consistent definitions — eliminating the metric inconsistency that undermines analytical trust in organizations using less governed BI approaches.
The Google Cloud integration positions Looker as the enterprise analytics component of the Google Cloud ecosystem, providing native BigQuery optimization, Vertex AI connectivity, and Google Workspace interoperability. The API-first architecture and extensive embedded analytics capabilities make Looker particularly compelling for SaaS companies building data-driven product features.
Business intelligence platforms including Looker, Tableau, Power BI, Qlik Sense, and Metabase each approach analytics with different architectural philosophies. Looker’s advantages center on semantic layer governance, code-based modeling, cloud warehouse-native architecture, embedded analytics depth, and the strong consistency assurance that comes from centralized metric definitions. Organizations evaluating analytics platforms should carefully consider their data governance maturity, technical team capabilities, cloud infrastructure investments, and the overall strategic importance of consistent metric definitions when comparing BI platform options.
Features, pricing, and availability discussed in this review reflect information available at the time of writing. Software products evolve continuously, and details may have changed since publication. Please verify current information directly on the official Google Cloud Looker website. WBAKT SaaS is an independent review platform with no affiliate relationships with any software company mentioned in this article.
For related analytics tools, see our reviews of Tableau, Power BI, and Google Data Studio.