Traditional business intelligence tools approach data analysis through predefined queries, dashboards, and report structures that guide users along predetermined analytical paths. While this structured approach serves routine reporting requirements effectively enough, it inherently limits the discovery of unexpected patterns, hidden correlations, and non-obvious insights that exist within complex organizational datasets. When analysts can only explore data along paths that have been explicitly configured, the vast majority of potential insights — the connections and relationships that no one thought to look for — remain undiscovered in the gaps between predefined analytical views. Qlik Sense directly addresses this discovery limitation through its unique Associative Engine that indexes all data relationships and enables unlimited exploration across any combination of data fields, creating an analytics experience where discovering unexpected connections and patterns is as natural and immediate as following predetermined analytical paths.
Originally founded in 1993 as QlikTech in Lund, Sweden, the company pioneered the concept of in-memory associative analytics with QlikView before introducing Qlik Sense in 2014 as a modern, self-service analytics platform. Qlik Sense maintained the revolutionary Associative Engine architecture while adding responsive design, augmented intelligence, cloud deployment, and modern user experience design. Acquired by Thoma Bravo in 2016, Qlik strategically expanded through acquisitions of Attunity (data integration), Podium Data (data catalog), and NodeGraph (data lineage), building a comprehensive and integrated analytics platform that spans data integration, data quality, analytics, and active intelligence. Understanding Qlik Sense’s unique associative technology, augmented analytics capabilities, and enterprise deployment options helps organizations evaluate whether this discovery-focused analytics platform meets their business intelligence requirements.
Associative Engine
The Associative Engine is Qlik Sense’s fundamental technological differentiator. Unlike traditional query-based BI tools that retrieve specific data subsets through SQL queries, the Associative Engine loads entire data models into memory and indexes all field relationships, enabling instant exploration across any data dimension without predefined queries or hierarchies. When users make selections in any field, the engine instantly highlights associated values across all other fields in green (associated), white (possible but not currently selected), and gray (excluded), revealing relationships throughout the entire dataset simultaneously and visually. This visual association mechanism enables users to explore data freely by clicking and selecting values, discovering connections that traditional query-based approaches cannot surface because they fundamentally require knowing what to ask before querying the data.

Smart Search
Qlik Sense Smart Search enables searching across all data in the application through a unified search interface. Users type search terms that match across field values, dimension labels, and measure names simultaneously. Search results instantly highlight matching values across multiple fields, enabling cross-dimensional discovery through natural text input. The search-based approach provides a valuable alternative exploration method for users who know what they are looking for but not which field or dimension contains it — a common scenario when exploring unfamiliar datasets or investigating specific data points across complex multi-table data models.
Visualization and Sheets
Qlik Sense provides responsive visualization creation through a drag-and-drop interface. Chart types include bar charts, line charts, combo charts, scatter plots, pie charts, treemaps, waterfall charts, funnel charts, gauge charts, KPI objects, tables, pivot tables, maps, and text/image objects. Sheets organize visualizations into cohesive analytical views with responsive layouts that automatically adapt to different screen sizes. The Selection Bar displays current filter selections prominently, maintaining awareness of analytical context. Alternate states enable comparing different selection states simultaneously within dashboards, creating side-by-side analytical comparisons within the same visualization. Master items (dimensions, measures, and visualizations) provide reusable, governed, and centrally managed analytical components that ensure consistency across sheets and applications.
Augmented Analytics
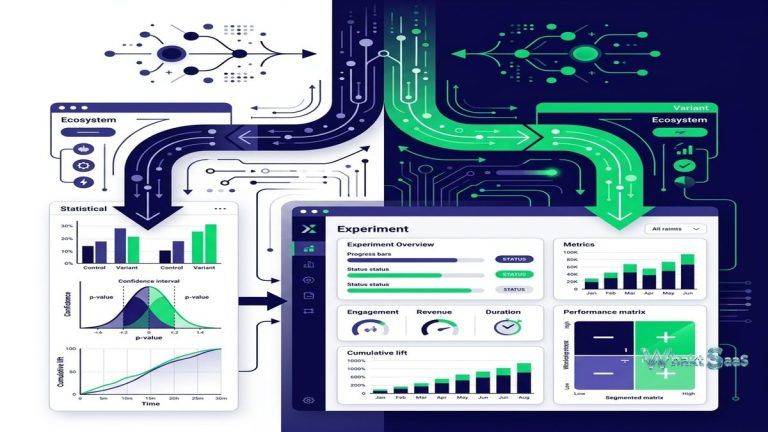
Insight Advisor provides AI-powered analytics that automatically generates visualization recommendations, suggests analytical explorations, and creates automated analyses. Natural language interaction enables users to type analytical questions and receive automatic chart generation. Insight Advisor Cognitive Engine learns from user behavior and data patterns to improve recommendation relevance over time. Associative Insights automatically identifies significant data patterns and statistical outliers within selected data, surfacing analytical findings that might not be apparent from visual chart inspection alone. For business users who lack deep analytical expertise, augmented analytics provides AI-guided data exploration that identifies relevant patterns and presents them through appropriate visualizations.
Data Integration
Qlik Sense Data Manager provides visual data integration that connects to and combines data from multiple sources. Direct connections support databases, cloud applications, files, and web sources. Data profiling automatically analyzes connected data sources for quality, completeness, and distribution characteristics. Auto-association intelligently identifies and suggests data relationships between tables based on field names and data content. Data transformation capabilities include concatenation, cross-table operations, data pivoting, and field derivation. Qlik Application Automation connects to over 500 SaaS applications, enabling event-driven data workflows that trigger analytical updates based on business events in connected platforms.
Data Storytelling
Data Storytelling enables creating presentation-style narratives that guide audiences through analytical findings. Stories combine snapshot visualizations, annotations, and narrative text into sequential presentations that communicate insights with context and interpretation. Each story slide captures a specific analytical view with descriptive commentary, creating guided analytical narratives for stakeholder presentations, strategic planning sessions, and board reports. The storytelling capability transforms exploratory analysis into structured communication, bridging the critical gap between data discovery and business action by connecting analytical findings to recommended decisions.
Qlik Cloud
Qlik Cloud provides fully managed cloud deployment that eliminates on-premises infrastructure requirements. Multi-cloud deployment supports deployment across AWS, Azure, and GCP regions. Tenant-based architecture provides isolated environments for different organizations or divisions. Qlik Cloud Analytics delivers the full and complete analytical experience through web browsers without desktop software installation. Qlik Cloud Data Integration provides managed data pipeline services for ETL, CDC (Change Data Capture), and data lake operations. For organizations seeking cloud-first analytics infrastructure and deployment, Qlik Cloud provides comprehensive analytical capabilities with reduced infrastructure management overhead and automatic updates that keep the platform current with latest capabilities.
Advanced Analytics Integration
Qlik Sense integrates with advanced analytics environments through Server Side Extensions (SSE) that enable calling Python, R, and other analytical engines from within Qlik calculations. Machine learning predictions, statistical computations, and custom algorithms execute in external environments and return results into Qlik Sense visualizations. This integration enables incorporating predictive models, clustering analysis, sentiment analysis, and other advanced analytical techniques within business-user-facing dashboards and applications without requiring data science expertise from end users.
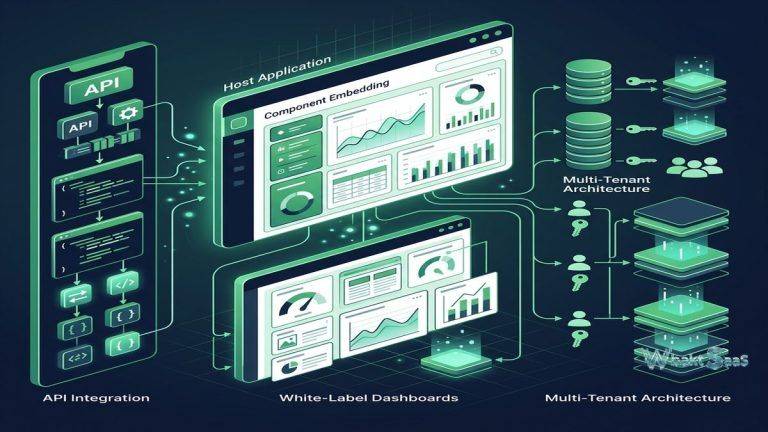
Mashup and Embedding
Qlik Sense provides embedding capabilities through the Mashup API, Capability APIs, and Nebula.js framework. These tools enable integrating individual visualizations and charts and complete analytical applications into external websites, portals, and applications. Single integration embedding places specific charts within external interfaces. Full application embedding provides the complete Qlik Sense experience within external application contexts. the APIs provide comprehensive programmatic control over selections, filtering, bookmarks, and user interactions, enabling custom analytical experiences that leverage Qlik’s Associative Engine within external application interfaces.
Governance and Security
Qlik Sense provides enterprise governance through Section Access that implements row-level security based on user identity and group membership. Security rules control access to applications, sheets, objects, and data at granular levels. Centralized management through the Management Console provides application deployment, user management, security configuration, and system monitoring. Content libraries organize and distribute shared resources across applications. Audit logging records platform activities for compliance documentation and security monitoring. For organizations with stringent governance requirements, Section Access combined with Active Directory or SAML integration provides controlled, auditable data access across the analytics platform.
Set Analysis and Expressions
Qlik Sense’s expression language provides powerful analytical calculation capabilities through set analysis — a syntax that modifies the selection context for specific calculations independently of the current user selections. Set analysis enables creating comparative metrics like “same period last year,” “all regions regardless of current selection,” and “customers who purchased product A but not product B” within single expressions. The expression language supports aggregation functions, conditional logic, string manipulation, date calculations, and advanced mathematical operations. Master measures create governed, reusable expressions that ensure calculation consistency across applications. For analysts building sophisticated analytical applications, set analysis provides analytical flexibility that distinguishes Qlik’s expression capabilities from formula languages in other BI platforms.
Alerting and Subscriptions
Qlik Sense provides data-driven alerting that monitors metric values and notifies users when conditions are met. Alert conditions trigger when values exceed, fall below, or change by specified amounts relative to defined thresholds. Alert evaluation runs on scheduled intervals, continuously monitoring analytical conditions without requiring users to manually check dashboards. Notifications deliver through the Qlik Sense activity center and email. Report subscriptions enable scheduled delivery of application content to specified recipients, distributing analytical insights to users who may not regularly access the platform directly. For operational monitoring scenarios, alerting converts passive dashboards into active monitoring systems that drive timely business responses.
Data Literacy and Training
Qlik invests significantly in data literacy initiatives, providing resources that help organizations build analytical skills across their workforce. Qlik Data Literacy Program offers free educational content on data literacy fundamentals, helping business users develop the skills needed to effectively interpret and act on data insights. Qlik Continuous Classroom provides structured learning paths for platform-specific skills. Certification programs validate proficiency at Data Analyst, Developer, and Administrator levels. For organizations where analytics adoption is limited by user skill levels rather than platform capabilities, Qlik’s data literacy investments support the organizational culture change that successful analytics deployment requires.
Community and Marketplace
Qlik Community provides forums, blogs, knowledge base articles, and community-contributed resources that support platform adoption. Qlik Branch provides community-contributed extensions that add custom visualization types, widgets, and integrations beyond built-in capabilities. The Qlik Marketplace offers certified extensions, connectors, and solutions from Qlik partners. Community-driven innovation through open-source extensions enables rapid capability expansion driven by real-world user needs. For organizations leveraging community resources to accelerate development and solve platform challenges, the community ecosystem provides valuable support alongside official documentation and training.
Qlik NPrinting
Qlik NPrinting provides automated report generation and distribution from Qlik Sense and QlikView applications. Reports generate in PDF, PowerPoint, Excel, Word, and HTML formats for distribution to stakeholders who need formatted documents rather than interactive dashboards. Report templates define layout, formatting, and data inclusion rules. Scheduled distribution automates report delivery on configured intervals. Conditional distribution routes reports to specific recipients based on data values, ensuring that each recipient receives relevant content. For organizations with formal reporting requirements — regulatory filings, board reports, customer deliverables — NPrinting bridges the gap between interactive analytics and formatted document production.
Mobile and Offline
Qlik Sense Mobile provides native applications for iOS and Android with responsive layouts optimized for touch interaction on smartphones and tablets. Offline access enables downloading complete applications for use without network connectivity — critical for field workers, traveling sales representatives, and environments with unreliable or restricted network connectivity. Touch-optimized interaction supports intuitive gestures for selection, navigation, and exploration on mobile devices. Push notifications alert users to dashboard updates, triggered data alerts, and collaborative messages. For organizations where data-driven decisions happen outside traditional office environments, mobile and offline access ensures that analytical insights are available wherever and whenever critical decisions need to be made.
Common Use Cases
Data Discovery: Analysts explore complex datasets using the Associative Engine to discover hidden patterns, unexpected correlations, and non-obvious relationships across all data dimensions that traditional query-based analytics tools cannot surface due to their predefined analytical path constraints.
Executive Analytics: Senior leaders use Qlik Sense dashboards for strategic decision support, leveraging augmented analytics to surface relevant insights without deep analytical expertise and data storytelling features to communicate findings clearly to boards and stakeholders.
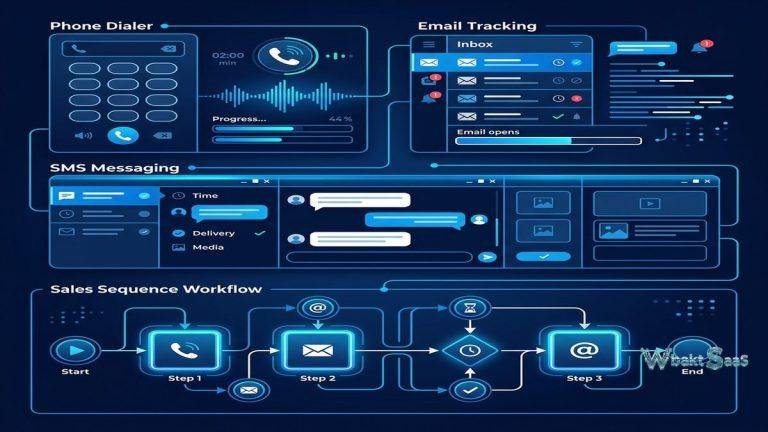
Sales Intelligence: Sales organizations analyze pipeline performance, customer buying patterns, cross-sell and upsell opportunities, and territory optimization through associative exploration that reveals connections between customer attributes, product preferences, and purchase behaviors.
Financial Analysis: Finance teams perform comprehensive budget analysis, profitability modeling, cost allocation, and financial forecasting with the ability to explore financial data associatively across accounts, departments, cost centers, time periods, and business units.
Supply Chain: Supply chain teams analyze inventory optimization, supplier performance scoring, logistics efficiency, demand forecasting, and procurement patterns through associative exploration across procurement, logistics, inventory, and demand data sources.
Healthcare: Healthcare organizations perform clinical outcome analytics, population health analysis, resource utilization optimization, and quality improvement through HIPAA-compliant analytics deployments with Section Access data security.
Manufacturing: Manufacturing organizations analyze production quality metrics, equipment performance, maintenance scheduling, yield optimization, and process efficiency through dashboards connected to production systems, IoT sensors, and quality management databases.
Pricing
Qlik Sense offers Business and Enterprise editions for Qlik Cloud. Business edition provides full analytics capabilities for smaller deployments. Enterprise edition provides advanced governance, embedding, and scale capabilities. Qlik Sense Client-Managed provides on-premises deployment with token-based licensing. Pricing varies by deployment model, user count, and feature requirements.
Pricing varies by edition and deployment. Please verify current pricing on the official Qlik website before making purchasing decisions.
Limitations
- Learning curve: The Associative Engine concept and set-analysis scripting language require learning investment for users accustomed to traditional query-based BI approaches.
- Data loading complexity: Complex data models may require scripting knowledge in Qlik’s proprietary load script language for advanced data transformation and model optimization.
- Memory requirements: The in-memory associative model requires substantial RAM for large datasets, potentially creating infrastructure cost considerations for data-intensive applications.
- Pricing complexity: Multiple licensing models and deployment options create pricing complexity that can be difficult to evaluate during initial platform comparison.
- Community size: While active, Qlik’s community is smaller than Tableau’s or Power BI’s, providing fewer community-contributed resources and third-party integrations.
Summary
Qlik Sense provides a discovery-focused analytics platform built on the unique Associative Engine that indexes all data relationships and enables unlimited exploration across any combination of data fields. This architectural approach enables genuine data discovery — finding patterns and connections that users did not know to look for — distinguishing Qlik Sense from query-based BI tools that constrain exploration to predefined analytical paths and preconfigured dashboard interactions.
The augmented analytics capabilities through Insight Advisor, comprehensive cloud deployment through Qlik Cloud, and the expanding data integration portfolio create a platform that addresses the complete analytics lifecycle from data ingestion through insight communication. Mobile and offline access extend analytical reach beyond desktop environments, ensuring data-driven decisions can happen wherever work occurs.
Business intelligence platforms including Qlik Sense, Tableau, Power BI, Looker, and Domo each approach analytics with fundamentally different technological foundations. Qlik Sense’s advantages center on associative data discovery, augmented intelligence automation, in-memory performance, embedded analytics through mashup APIs, and the discovery-oriented approach that prioritizes finding unexpected insights over confirming expected patterns. Organizations evaluating BI platforms should carefully consider whether discovery-oriented analysis or structured reporting better matches their primary analytical needs when comparing platforms.
Features, pricing, and availability discussed in this review reflect information available at the time of writing. Software products evolve continuously, and details may have changed since publication. Please verify current information directly on the official Qlik website. WBAKT SaaS is an independent review platform with no affiliate relationships with any software company mentioned in this article.
For related analytics tools, see our reviews of Tableau, Power BI, and Sisense.