Many organizations need focused, real-time performance monitoring dashboards rather than full-featured business intelligence platforms with complex data modeling, advanced analytics, and governance frameworks. Executive teams want live TV dashboards displaying key performance indicators in office common areas. Marketing teams need real-time campaign monitoring. Sales teams want live pipeline visibility. Operations teams need service health dashboards. These focused monitoring requirements often don’t need the analytical depth of enterprise BI platforms — they need clear, always-current visualizations of critical business metrics presented in formats optimized for at-a-glance comprehension and continuous display. Klipfolio directly and effectively addresses this focused dashboard and KPI monitoring segment with a platform specifically designed for creating real-time performance dashboards that display key business metrics from multiple data sources in customizable, always-on visual displays.
Founded in 2001 by Allan Wille in Ottawa, Canada, Klipfolio initially provided dashboard solutions for IT operations monitoring before evolving into a broader business dashboard platform. The company now operates two distinct and complementary products: Klipfolio (the original dashboard builder) and PowerMetrics (a newer, metric-focused analytics platform). Klipfolio’s dashboard builder provides flexible, customizable dashboard creation with extensive data connectivity, while PowerMetrics provides a more structured, metric-centric approach focused on defining, tracking, and analyzing key performance indicators with automated context and benchmarking. Understanding Klipfolio’s dashboard building capabilities, real-time monitoring features, PowerMetrics evolution, and deployment flexibility helps organizations organizations evaluate whether this KPI-focused platform meets their performance monitoring requirements.
Dashboard Builder
Klipfolio’s dashboard builder provides a canvas-based interface for creating custom performance dashboards using Klips (individual visualization widgets). Klip types include line charts, bar charts, pie charts, scatter plots, gauges, sparklines, tables, text displays, image displays, bullet charts, and custom HTML/CSS visualizations. The intuitive drag-and-drop canvas enables precise placement and sizing of Klips within dashboard layouts. Conditional formatting changes visualization colors and styles based on data values — highlighting positive performance in green and negative trends in red for immediate visual comprehension. Pre-built Klip templates provide ready-made starting points for common metrics from popular data sources, accelerating dashboard creation for standard monitoring scenarios.

Data Connectors
Klipfolio connects to over 100 pre-built data service connectors including Google Analytics, Google Ads, Facebook Ads, HubSpot, Salesforce, Shopify, QuickBooks, Xero, Zendesk, Jira, GitHub, MySQL, PostgreSQL, SQL Server, and many more. REST API connector enables connecting to any web service with API access. File upload connector imports data from Excel, CSV, and JSON files. Custom connectors using Klipfolio’s flexible data modeling framework enable integration with proprietary and specialized data sources not covered by pre-built connectors. For organizations with diverse data source landscapes, the connector library combined with REST API flexibility ensures that critical business metrics from any source can feed into Klipfolio’s monitoring dashboards.
Real-Time Monitoring
Klipfolio provides configurable data refresh intervals that keep dashboards current with the latest metric values. Refresh frequencies range from minutes to hours depending on data source capabilities and plan tier. Auto-refresh ensures that dashboards always display the most current data without manual intervention. TV display mode provides full-screen, auto-rotating dashboard displays optimized for office monitors and large display screens. Multiple dashboard rotation automatically cycles through different dashboards on configured intervals, enabling comprehensive monitoring across different metric categories on a single display. For operations centers, sales floors, marketing war rooms, and office common areas, Klipfolio’s TV display capabilities create always-on performance visibility that keeps entire teams aware of current business performance.
PowerMetrics
PowerMetrics represents Klipfolio’s evolution toward metric-centric analytics. Rather than building dashboards from scratch, PowerMetrics focuses on defining individual metrics with automated context including historical trends, period-over-period comparisons, segmentation, and goal tracking. Metric definitions establish precisely how each KPI is calculated, what data sources feed it, and how it should be interpreted. Metric homepages provide individual metric views with automated analytical context — trend visualization, comparison to previous periods, segmentation by dimensions, and goal progress tracking. Metric boards combine multiple metrics into dashboard-like views. The metric-centric approach ensures that every single KPI has consistent definition, automated context, and accessible interpretation regardless of who is viewing it or where they encounter it.
Data Modeling and Formulas
Klipfolio provides a data modeling layer that transforms raw data source values into meaningful business metrics. Formula functions support arithmetic calculations, date operations, text manipulation, conditional logic, aggregation, and statistical computations. Calculated metrics create derived KPIs from raw data fields — conversion rates from impressions and conversions, average deal sizes from revenue and deal counts, customer lifetime values from purchase histories. Data source blending combines values from different connectors within single Klips, enabling valuable cross-platform metrics like cost-per-acquisition that combine advertising spend from one source with conversion data from another.
Sharing and Distribution
Klipfolio dashboards share through multiple distribution methods. Published links provide secure view-only access to dashboards via web URLs without requiring Klipfolio accounts. Email snapshots deliver dashboard screenshots to recipients on scheduled intervals. PDF exports generate formatted dashboard documents for offline distribution. Embedded dashboards seamlessly integrate into external websites, intranets, and applications through iframe embedding. Slack integration delivers metric updates and dashboard snapshots to Slack channels. For organizations distributing performance metrics to stakeholders who don’t need dashboard editing capabilities, sharing options ensure that KPI visibility extends beyond active Klipfolio users to the broader organizational audience.
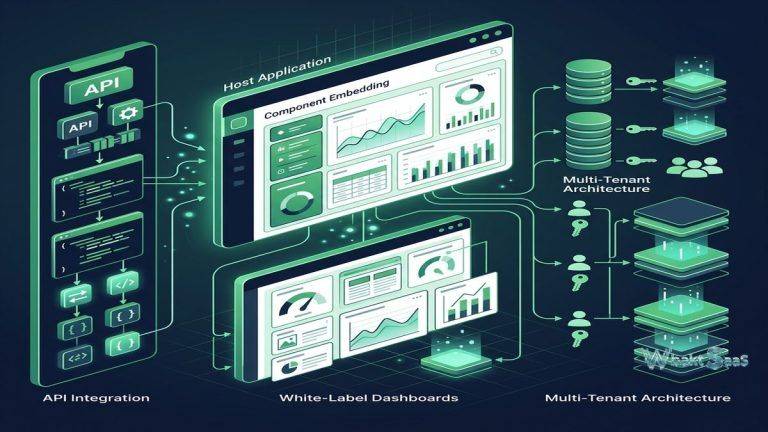
White-Label Dashboards
Klipfolio provides white-label capabilities for agencies, consultants, and service providers who create dashboards for clients. Custom branding completely replaces Klipfolio branding with the agency’s own logos, colors, and visual identity. Custom domains serve dashboards from the agency’s or client’s own domain name. Client management features enable organizing and managing dashboards for multiple clients from a single agency account. For marketing agencies, managed service providers, and consulting firms that include performance reporting as part of their client deliverables, white-label capabilities create professional, branded reporting experiences that reinforce the agency’s brand rather than exposing third-party platform branding.
Custom Visualizations
Beyond standard chart types, Klipfolio supports custom HTML, CSS, and JavaScript visualizations that enable creating entirely custom visual displays. Custom visualizations enable specialized display formats like countdown timers, progress indicators, custom gauges, animated displays, and industry-specific visual formats that standard chart types cannot adequately represent. The custom visualization capability provides unlimited visual flexibility for organizations with unique monitoring display requirements that extend beyond conventional charting. For organizations with specific brand guidelines or specialized monitoring needs, custom visualizations ensure that dashboards can match precise visual specifications.
Goals and Targets
Klipfolio and PowerMetrics support goal definition that overlays target values on metric visualizations. Goal lines on charts display target thresholds alongside actual performance. Color coding indicates whether metrics are tracking above, at, or below defined targets. Progress indicators show percentage completion toward goals. For performance-driven organizations where metrics serve accountability functions — sales targets, marketing goals, operational SLAs, financial budgets — goal integration transforms dashboards from passive monitoring displays into active performance management tools that continuously communicate progress toward defined objectives.
API and Automation
The Klipfolio API provides programmatic access for dashboard management, data source configuration, user administration, and content management. API-driven automation enables integrating Klipfolio dashboard management into organizational workflows, deployment pipelines, and administrative processes. Zapier integration connects Klipfolio to thousands of applications through automated workflows, enabling trigger-based dashboard updates and notification routing. For organizations managing dashboards at scale — particularly agencies managing client dashboards — API automation reduces manual management overhead and enables standardized, repeatable dashboard deployment processes.
Team Collaboration
Klipfolio supports multi-user collaboration with role-based access controls. User roles define permissions for viewing, editing, and managing dashboards and data sources. Shared dashboards enable team-wide visibility of performance metrics. Dashboard annotations enable users to add contextual notes explaining metric changes, unusual values, or strategic context. For organizations where dashboard metrics serve team discussions, planning sessions, and accountability meetings, collaboration features ensure that performance data is accompanied by the organizational context needed for meaningful interpretation.
Klip Editor
The Klip Editor provides a detailed visualization configuration interface for building custom Klips with granular control over data mapping, formatting, and visual behavior. Data source binding connects specific data fields to chart axes, labels, and values. Series configuration controls individual data series colors, styles, and display options. Drill-down configuration defines hierarchical data navigation for interactive exploration within individual Klips. The editor provides the configuration depth needed for building precisely customized visualizations that match specific organizational requirements and brand guidelines.
Data Sources Hub
Klipfolio’s Data Sources Hub provides centralized management of all connected data source configurations. Data source definitions are reusable across multiple Klips and dashboards, ensuring consistent data connectivity and reducing redundant configuration. Data source health monitoring identifies connection errors, authentication failures, and refresh problems. Historical data retention stores retrieved data for trend analysis and period-over-period comparison. For organizations managing dozens of data connections across multiple dashboards, centralized data source management provides operational efficiency and troubleshooting visibility that distributed configurations cannot match.
Notifications and Alerts
Klipfolio provides configurable alert notifications that trigger when metric values cross defined thresholds. Alert conditions support greater-than, less-than, equals, and percentage change comparisons. Notification delivery through email and Slack ensures that critical metric changes reach responsible stakeholders promptly. Alert scheduling controls evaluation intervals for threshold monitoring. For performance-critical monitoring scenarios — revenue targets, SLA compliance, inventory levels, application uptime — alerts convert passive dashboard monitoring into proactive notification systems that drive immediate response to business-critical metric changes.
Client Management
Klipfolio’s client management capabilities enable agencies and service providers to organize dashboards by client, manage client-specific data connections, and control access permissions across client accounts. Client grouping provides organized dashboard management for agencies serving multiple clients simultaneously. Template dashboards enable deploying standardized monitoring configurations across new client onboarding without rebuilding dashboards from scratch. Client-specific branding ensures that each client’s dashboards reflect appropriate visual identity. For agencies where dashboard creation and management represent recurring service deliverables, client management features streamline the operational workflow of multi-client performance reporting.
Security and Access Control
Klipfolio implements security through encrypted data transmission, secure credential storage for data source authentication, and role-based access controls for platform features. SSO integration supports SAML authentication for enterprise environments. User groups enable managing permissions at the team level rather than individual user level. Data source credentials are encrypted and stored securely, protecting authentication tokens and API keys used for data connectivity. For organizations handling sensitive performance data, Klipfolio’s security implementation provides appropriate protection for business metrics and data source credentials.
Mobile Access
Klipfolio provides mobile-responsive dashboard viewing through web browsers and native mobile applications for iOS and Android devices. Mobile-optimized layouts adapt dashboard designs for smartphone and tablet screens while maintaining interactive capabilities including filtering and drill-down exploration. Push notifications deliver metric alerts to mobile devices when values cross defined thresholds. Favorites enable quick access to frequently monitored dashboards. For executives and managers who monitor business performance throughout their day regardless of location, mobile access ensures that critical KPI visibility extends beyond desktop and TV environments to wherever business decisions are made.
Common Use Cases
Executive KPI Dashboards: C-suite leaders monitor organizational health through TV-displayed dashboards showing revenue, growth rates, customer acquisition metrics, operational performance, and strategic initiative progress updated in real-time from multiple data sources across the entire business.
Marketing War Rooms: Marketing teams create real-time campaign monitoring dashboards displaying advertising spend, impressions, click-through rates, conversions, cost-per-acquisition, and ROI across Google Ads, Facebook, LinkedIn, and other advertising platforms for continuous campaign optimization.
Sales Performance Boards: Sales organizations display live pipeline values, quota progress, deal velocity, representative performance rankings, and forecast tracking on office displays that maintain competitive visibility and team accountability throughout the sales cycle.
SaaS Metrics: Software companies monitor MRR, ARR, churn rate, customer acquisition cost, lifetime value, active users, trial conversion, and feature adoption through dashboards connecting to billing, analytics, and product usage data sources.
Agency Client Reporting: Marketing and digital agencies create white-labeled client dashboards displaying campaign performance, website analytics, social media metrics, and business KPIs under the agency’s own branding and domain for professional client communication and service delivery.
IT Operations: IT teams monitor infrastructure health, application performance, service desk metrics, incident tracking, uptime statistics, and SLA compliance through real-time dashboards connected to monitoring tools, ticketing systems, and infrastructure platforms.
Customer Success: Customer success teams track client health scores, product usage metrics, renewal timelines, support ticket trends, NPS scores, and engagement indicators through dashboards that enable proactive account management and retention optimization.
Pricing
Klipfolio offers tiered pricing based on dashboard count, user count, and feature access. Plans range from free individual plans with limited dashboards to professional and business plans with expanded capabilities. PowerMetrics provides separate pricing for metric-centric analytics. Agency and enterprise plans provide white-label capabilities and expanded client management features.
Pricing varies by plan and requirements. Please verify current pricing on the official Klipfolio website before making purchasing decisions.
Limitations
- Analytical depth: Klipfolio focuses on KPI monitoring rather than exploratory analytics, providing less analytical depth for complex data exploration compared to full-featured BI platforms.
- Data modeling: Data modeling capabilities are more limited than enterprise BI platforms for complex multi-table analytical models and advanced calculated measures.
- Connector count: While adequate for most monitoring scenarios, the connector library is smaller than enterprise BI platforms like Power BI or Domo.
- Advanced governance: Row-level security, audit logging, and enterprise governance features are limited compared to enterprise-focused analytics platforms.
- Visualization types: Standard visualization variety is more limited than Tableau’s extensive chart library, though custom HTML/CSS visualizations provide flexibility for specialized needs.
Summary
Klipfolio provides a focused, KPI-centric dashboard platform that excels at creating real-time performance monitoring displays for organizations that need always-current metric visibility rather than complex analytical exploration. The TV display mode, configurable refresh intervals, and visual customization capabilities create compelling office-display dashboards that keep entire teams aware of current business performance throughout their workday.
The dual-product approach — Klipfolio for flexible dashboard building and PowerMetrics for structured metric management — provides options for different organizational approaches to performance monitoring. White-label capabilities serve agencies and service providers who need branded client reporting. The connector library and REST API flexibility ensure that metrics from diverse data sources can feed into unified monitoring displays.
Dashboard and KPI monitoring platforms including Klipfolio, Geckoboard, Databox, and Cyfe each serve the performance monitoring segment with different feature emphases and pricing models. Klipfolio’s advantages center on visualization flexibility through custom HTML/CSS, TV display optimization, white-label depth, PowerMetrics metric management, and the balance between customization capability and ease of use for focused performance monitoring scenarios. Organizations evaluating KPI dashboard platforms should consider whether focused monitoring or comprehensive analytics better matches their primary data visualization requirements when comparing dedicated dashboard tools against full-featured BI platforms.
Features, pricing, and availability discussed in this review reflect information available at the time of writing. Software products evolve continuously, and details may have changed since publication. Please verify current information directly on the official Klipfolio website. WBAKT SaaS is an independent review platform with no affiliate relationships with any software company mentioned in this article.
For related analytics tools, see our reviews of Google Looker Studio, Zoho Analytics, and Metabase.