Spreadsheets remain the most ubiquitous business tool in the world. Decades of familiarity have made the row-and-column grid the default interface for organizing, tracking, and analyzing business information. Yet traditional spreadsheets falter when teams need to collaborate in real-time, automate workflows, enforce process consistency, and manage work with the structured capabilities of project management software. Smartsheet bridges this divide by building a work management platform on a spreadsheet foundation — preserving the familiar grid interface that billions of users already understand while adding project management, automation, resource management, and enterprise collaboration capabilities that traditional spreadsheets cannot provide.
Since its founding in 2005, Smartsheet has grown into an enterprise work management platform serving organizations across industries including technology, healthcare, financial services, government, construction, and education. Its fundamental bet — that adoption barriers decrease dramatically when the interface feels like a tool people already know — has proven correct, with millions of users managing projects, processes, and portfolios through Smartsheet’s enhanced spreadsheet environment. Understanding where Smartsheet’s spreadsheet-plus-project-management approach excels and where its compromises create limitations helps organizations evaluate whether this platform suits their work coordination needs.
Sheet-Based Architecture
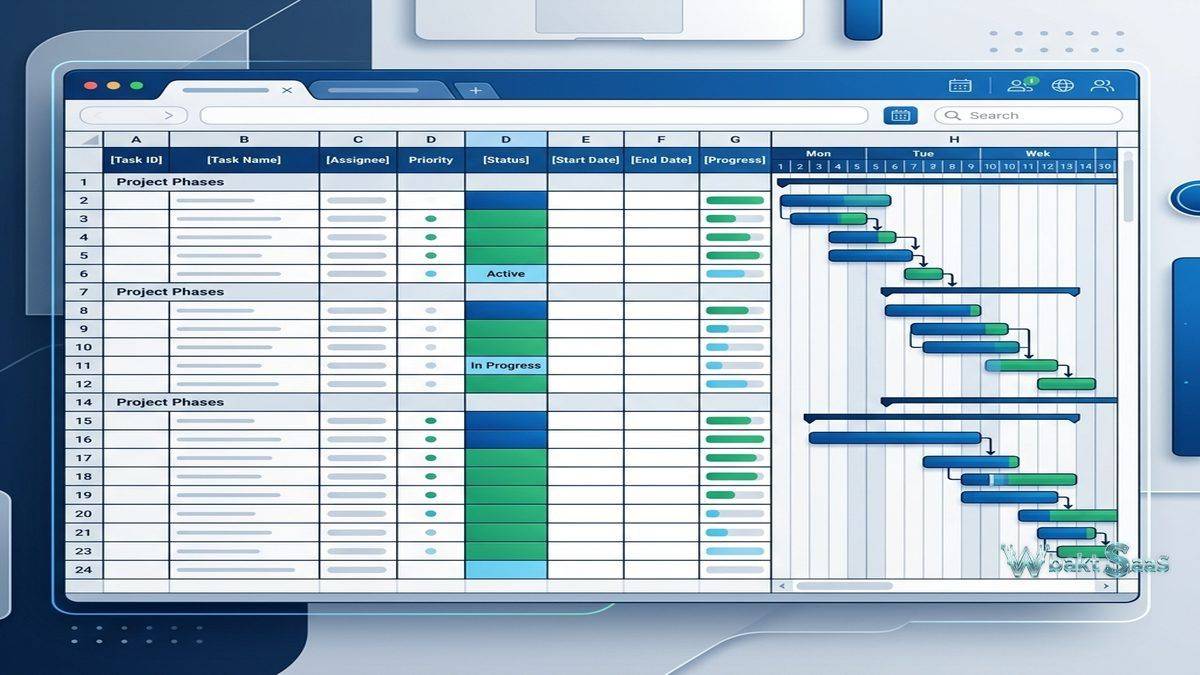
Smartsheet’s core unit is the sheet — a grid of rows and columns that looks and behaves like a spreadsheet but includes project management capabilities embedded within the familiar structure. Rows represent tasks, items, records, or any other unit of information. Columns define properties — task names, assignees, status values, dates, descriptions, checkboxes, dropdown selections, formulas, and custom data types. The immediate familiarity of this grid interface is Smartsheet’s primary onboarding advantage: users who have worked with Excel or Google Sheets can navigate a Smartsheet grid without training.
However, Smartsheet sheets differ from traditional spreadsheets in important ways. Row hierarchy supports parent-child relationships through indentation, creating collapsible task structures that organize work into logical groups. Dependencies between rows establish task sequencing with automatic date adjustment when predecessor schedules change. Predecessors, duration, and percentage complete columns enable Gantt chart functionality directly within the grid. Cell history tracks all changes to individual cells with timestamps and author identification, providing an audit trail that traditional spreadsheets lack.
Column types enforce data consistency in ways that traditional spreadsheets do not. A “Status” column configured as a dropdown only accepts values from the predefined list — preventing the free-text inconsistencies that make spreadsheet data unreliable at scale. Contact columns validate email addresses and connect to organizational directories. Date columns enforce date formatting. Auto-number columns generate unique sequential identifiers. These typed columns transform the spreadsheet from a free-form data container into a structured data management tool.
Views
Smartsheet provides multiple views that present the same underlying sheet data from different perspectives:
Grid View: The default spreadsheet interface with rows, columns, and the full range of data management capabilities. Grid view is the primary editing interface for data entry, formula management, and detailed task configuration.
Gantt View: An integrated timeline display that appears alongside the grid, showing task bars, dependencies, critical path highlighting, and milestone markers. The Gantt chart automatically generates from task dates, durations, and dependency relationships defined in the grid, maintaining synchronization without separate timeline configuration.
Card View: Tasks displayed as movable cards organized in columns based on a designated grouping field (typically status or category). Card view provides Kanban-style workflow management for teams that prefer visual task progression over grid-based tracking.
Calendar View: Tasks with date fields plotted on a calendar display. Calendar view serves scheduling overview and deadline management, showing task distribution across days, weeks, and months.
Board View: An enhanced card-based view with configurable swim lanes, color coding, and priority-based card sizing that provides more visual richness than the basic Card view.

Automation
Smartsheet automation eliminates manual work through configurable trigger-action workflows. Triggers include row changes (status updates, date arrivals, new rows), time-based schedules (daily, weekly, monthly), and form submissions. Actions include sending notifications, requesting approvals, updating cell values, moving or copying rows between sheets, recording dates, and locking rows.
Common automation patterns include: sending notification emails when tasks are assigned, requesting manager approval when status changes to “Ready for Review,” automatically recording completion dates when status changes to “Complete,” moving completed items from active sheets to archive sheets, and sending recurring reminders for overdue tasks. These automations reduce the administrative overhead that prevents teams from maintaining accurate project data — when status updates trigger automatic notifications and date recording, keeping the sheet current requires less deliberate effort from team members.
Alert and action-based automations support conditional logic, allowing sophisticated branching based on cell values. When a row’s “Priority” column is “Urgent” AND the “Department” column is “Engineering,” a specific notification chain activates with different recipients and escalation timing than lower-priority items. This conditional logic enables automation rules that respect organizational process variations without requiring separate automation configurations for each scenario.
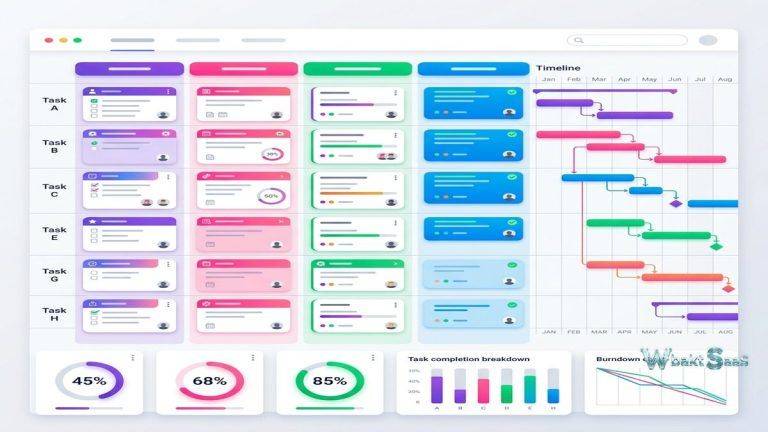
Dashboards
Smartsheet dashboards aggregate information from multiple sheets into visual summary displays. Dashboard widgets include charts (bar, pie, line, column), metric widgets displaying key numbers, shortcut widgets linking to frequently accessed sheets, rich text widgets for instructional content, report widgets showing filtered data views, and web content widgets embedding external pages.
Portfolio dashboards summarize project health across multiple initiatives, showing status distributions, timeline summaries, budget tracking, and risk indicators. Team dashboards display workload, task completion rates, and upcoming deadlines for specific groups. Executive dashboards present high-level organizational metrics without exposing the detailed task data that operational teams manage. The ability to construct audience-specific views from the same underlying data ensures that each stakeholder sees information at the appropriate level of detail.
WorkApps
Smartsheet WorkApps extend the platform from data management into lightweight application delivery. WorkApps allow administrators to create role-based application interfaces that present specific sheets, reports, dashboards, forms, and web content in a curated portal. Different roles see different content — project managers see planning sheets and resource reports, team members see their assigned tasks and submission forms, executives see summary dashboards — all powered by the same underlying Smartsheet data.
This application layer transforms Smartsheet from a tool that users navigate directly into a platform that delivers focused experiences to different audiences. The distinction matters for organizations where some users need full sheet access while others need only to submit information, view status, or review summaries without the complexity of navigating the full spreadsheet environment.
Resource Management
Smartsheet’s Resource Management (formerly 10,000ft) provides workforce planning and project staffing capabilities. Resource managers view team availability, skill profiles, and utilization rates across the project portfolio. Project staffing requests match resource needs with available team members based on skills, availability, and allocation percentages.
Time tracking within Resource Management captures actual effort against planned allocations, revealing utilization patterns and estimation accuracy. Capacity planning forecasts future resource availability based on current project assignments and planned initiatives, helping leadership make informed decisions about hiring, contractor engagement, and project scheduling based on realistic capacity projections rather than assumptions.
Forms and Data Collection
Smartsheet forms provide structured data intake that populates sheet rows automatically. Form builders create custom forms with conditional logic, required field validation, and branding customization. Forms serve as intake mechanisms for work requests, survey responses, incident reports, and any scenario where structured information must flow from submitters into organized sheet data.
Conditional form logic shows or hides fields based on previous responses, ensuring that submitters see only relevant questions for their specific request type. A general IT request form might branch into hardware request fields, software access fields, or network issue fields based on the initial category selection. This intelligent branching improves submission quality by presenting context-appropriate questions while preventing unnecessary form length for simpler request types.
Integrations
Smartsheet integrates with Microsoft 365, Google Workspace, Slack, Salesforce, Jira, ServiceNow, Adobe Creative Cloud, DocuSign, and hundreds of additional applications through native connectors and the Smartsheet API. The Microsoft Teams integration embeds Smartsheet sheets, reports, and dashboards directly within Teams channels, providing project visibility within the communication environment where many enterprise teams spend their working hours.
Data Shuttle provides automated data import and export between Smartsheet and external systems through scheduled file transfers. Organizations use Data Shuttle to synchronize data between Smartsheet and ERP systems, financial platforms, HRIS systems, and other enterprise applications that exchange data through file-based mechanisms. Connectors provide more sophisticated bidirectional synchronization with specific platforms including Jira, Salesforce, and Microsoft Dynamics.
Collaboration and Sharing
Smartsheet supports multi-user collaboration with real-time editing, cell-level comments, row-level discussions, and @mentions that notify specific team members. Sharing permissions control access at the sheet, workspace, and individual level with Owner, Admin, Editor, Commenter, and Viewer permission levels. External sharing allows collaboration with people outside the organization — clients, vendors, contractors — without requiring Smartsheet accounts for view-only access.
Row-level notifications alert team members when specific rows are modified, when they are assigned to tasks, or when comments require their attention. Cell change notifications track modifications to critical data fields, ensuring that stakeholders are informed when important values change. These targeted notifications keep relevant team members informed without overwhelming everyone with every change across the entire sheet.
Published sheets and reports generate shareable URLs that display sheet data in a read-only web format accessible to anyone with the link. Published views are useful for sharing project status with broader audiences — company-wide updates, client-facing project timelines, or public resource directories — without granting direct sheet access or requiring viewers to have Smartsheet accounts.
Proofing
Smartsheet’s proofing feature enables visual asset review directly within the platform. Images, PDFs, documents, and videos attached to rows can be opened in the proofing viewer where reviewers place pin-based comments on specific locations within the asset. Proof approval workflows track reviewer status — pending, approved, changes requested — providing clear visibility into where each deliverable stands in the review process. Version comparison allows reviewers to view revisions side by side, confirming that requested changes have been implemented correctly. For creative teams, marketing departments, and agencies managing high volumes of visual content, built-in proofing reduces the tool fragmentation of coordinating reviews through email or separate proofing platforms.
Common Use Cases
Construction Project Management: Construction firms manage project schedules, subcontractor coordination, inspection tracking, and compliance documentation in Smartsheet. Gantt charts track construction timelines with dependency management across project phases. Mobile access enables field teams to update task status and attach site photographs from construction locations.
Marketing Campaign Management: Marketing teams coordinate campaign planning, creative production, content calendars, and launch timelines. Proofing features streamline creative asset review. Dashboards aggregate campaign metrics across multiple simultaneous initiatives. Automation sends alerts when deadlines approach and escalates overdue deliverables.
IT Program Management: IT organizations manage software development projects, infrastructure upgrades, and change management processes with customized workflows that enforce governance requirements. Request forms handle service ticket intake. Reports track SLA compliance across IT operations.
Financial Planning: Finance teams use Smartsheet for budget tracking, expense management, and financial reporting. Formula capabilities handle financial calculations, while dashboards present financial summaries to leadership. Controlled sharing ensures that sensitive financial data remains accessible only to authorized personnel.
Reports
Smartsheet reports aggregate data from multiple sheets into unified views without duplicating data. A cross-project status report might pull task data from twenty different project sheets, displaying all items with “At Risk” status in a single consolidated view. Reports update dynamically as source sheet data changes, ensuring that report consumers always see current information without manual report regeneration.
Report filtering, sorting, and grouping capabilities allow precise data presentation tailored to specific audiences. Summary fields aggregate numerical data across report rows, providing totals, averages, and counts that summarize the reported data set. Row-level access controls in reports respect the sharing permissions of underlying sheets, ensuring that report viewers only see data from sheets they have permission to access.
Security and Administration
Enterprise security features include SAML-based SSO, automated user provisioning through SCIM, custom domain management, audit reporting, and data encryption. Smartsheet Gov provides a FedRAMP-authorized environment for United States government agencies. Administrative controls manage sharing policies, integration permissions, and data governance at the organizational level.
Pricing
Smartsheet pricing follows per-user plans with Pro, Business, Enterprise, and Advanced Enterprise tiers. Each tier expands sheet limits, automation capacity, feature access, and administrative capabilities. The free tier provides limited access for evaluation purposes.
Pricing and features are subject to change. Please verify current plan details on the official Smartsheet website before making purchasing decisions.
Limitations
- Not a full spreadsheet: Despite its grid interface, Smartsheet lacks the advanced calculation, charting, and data analysis capabilities of Excel or Google Sheets. Users expecting full spreadsheet functionality may find the formula and analysis tools insufficient.
- Sheet scaling limits: Individual sheets have row and column limits that large-scale data management may exceed, requiring architectural decisions about data distribution across multiple sheets.
- Cost at scale: Per-user pricing combined with feature-gating across plan tiers can make large deployments expensive, particularly when many users need access to higher-tier features.
- Complexity growth: As organizations build increasingly sophisticated solutions with cross-sheet references, automation chains, and multi-dashboard reporting, the environment can become complex to maintain and troubleshoot.
- Learning curve for advanced features: While the basic grid interface is immediately familiar, advanced features including automation, cross-sheet formulas, WorkApps, and Resource Management require significant learning investment.
Summary
Smartsheet successfully leverages spreadsheet familiarity as an onboarding advantage while providing work management capabilities that traditional spreadsheets cannot match. For organizations where spreadsheets are already the primary work tracking mechanism — and many organizations fall into this category — Smartsheet provides a natural upgrade path that preserves the grid-based workflow while adding project management structure, collaboration, automation, and reporting capabilities.
The platform’s mobile applications for iOS and Android provide field access to sheets, forms, dashboards, and notifications, supporting team members who need to interact with project data from construction sites, client locations, conferences, or other remote environments. Mobile editing capabilities include task updates, attachment capture through device cameras, comment posting, and approval responses — covering the most common mobile interaction patterns without attempting to replicate the full desktop experience on smaller screens.
Organizational adoption benefits from Smartsheet’s spreadsheet familiarity but requires investment in training for advanced features. The gap between basic grid usage and sophisticated automated workflows with cross-sheet references, Resource Management, and WorkApps represents a meaningful learning journey. Organizations that invest in champion users, template standardization, and governance frameworks realize significantly more value than those that deploy Smartsheet without adoption support infrastructure.
Work management platforms such as Smartsheet, Monday.com, Asana, Wrike, and Airtable each approach organizational work coordination with different interface philosophies and feature priorities. Smartsheet’s advantage centers on spreadsheet familiarity, Gantt chart integration, and enterprise-grade administration and security. Organizations evaluating work management platforms should consider their teams’ comfort with different interface paradigms, project management methodology requirements, and enterprise governance needs when selecting the platform that best supports their work coordination.
Features, pricing, and availability discussed in this review reflect information available at the time of writing. Software products evolve continuously, and details may have changed since publication. Please verify current information directly on the official Smartsheet website. WBAKT SaaS is an independent review platform with no affiliate relationships with any software company mentioned in this article.
For related work management tools, see our reviews of Wrike enterprise work management, Airtable database platform, and Monday.com workflow automation.